Business Development Status Analysis Graph – Key Insight Visualization
RJ0300060_8
- Last Update 05/04/2025
- File Size 0.3MB
- # of Slides 2
- File Format PPTX
- Slide Ratio 16:9
- Color
Keywords
- #Content-Based Slides
- #Design-Based Slides
- #Product/Service Introduction
- #Market and Competitor Analysis
- #Graph
- #Development Status
- #Market Share
- #Circles
- #Other
- #Doughnut Chart
- #Other Charts
- #16:9
- #donut chart PowerPoint slide
- #pie chart template
- #ratio analysis graph
- #business development chart
- #multi-color circular chart PowerPoint
About the Product
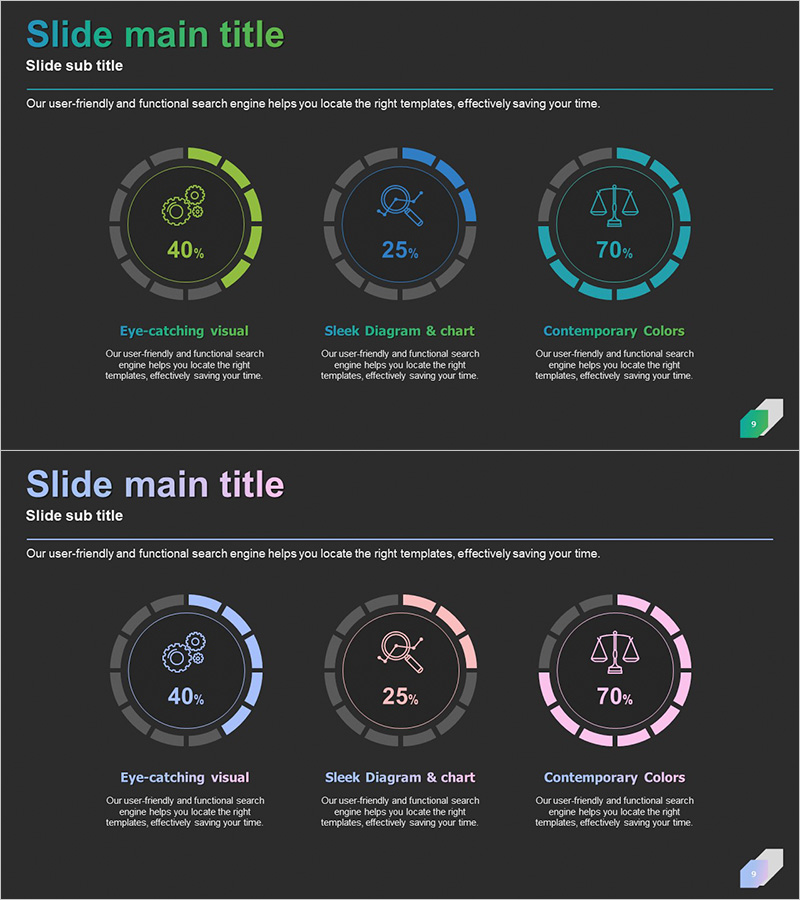
A PowerPoint slide featuring three donut charts for visualizing business development status and key performance indicators. Each circular chart displays distinct percentages (40%, 25%, 70%) in lime, blue, and cyan colors, enabling quick data comparison at a glance. Set against a dark background with supporting icons and descriptive text, this slide template is ready for immediate use in presentations and reports. The 16:9 format with 2 slides is ideal for presenting market share, development progress, performance metrics, and other business analytics.
Usage Points
-
Main Usage
Designed to present ratio-based data such as business development status, market share, and performance metrics in an intuitive visual format. Three independent donut charts allow simultaneous comparison of multiple percentage-based indicators across different categories.
-
How to Use
Enter metric titles and descriptions below each donut chart to clarify what each visualization represents. Percentages are displayed at the chart center, and color differentiation makes category composition immediately recognizable. Use in quarterly reports, executive dashboards, and business presentations.
-
Recommended For
Marketing managers, business development teams, financial analysts, and executives preparing status reports. Ideal for market analysis, customer composition ratios, product sales performance, organizational structure percentages, and any data visualization requiring ratio-based representation.
-
Slide Structure
2-slide set with the first slide featuring lime, blue, and cyan donut charts, and the second slide presenting a blue, pink, and purple color variation. Each chart includes center percentage display, bottom icon placement, title field, and descriptive text area for customization.
Related Products
-

Doughnut Chart for System Development Status Progress Visualization
#Product/Service Introduction #Market and Competitor Analysis #Graph
-

Analysis of Transportation Usage Status – Pie Chart
#Product/Service Introduction #Market and Competitor Analysis #Graph
-

Business Investment Idea Analysis Circle Graph – Visualizing Market Share
#Product/Service Introduction #Market and Competitor Analysis #Graph
-

Business Idea Development Status Graph – Ideas and Growth
#Product/Service Introduction #Market and Competitor Analysis #Graph
