Leather Material Presentation Template Diagram – Market Share Analysis
RJ0200021_7
- Last Update 04/03/2025
- File Size 6.8MB
- # of Slides 2
- File Format PPTX
- Slide Ratio 16:9
- Color
Keywords
About the Product
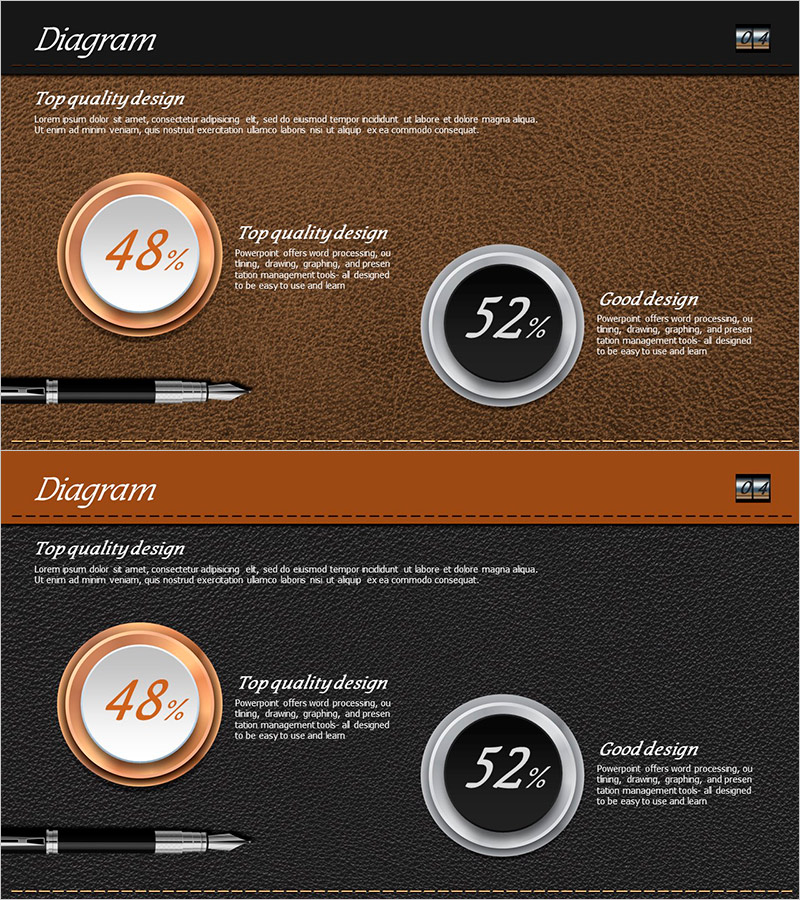
A 2-slide PowerPoint presentation designed for market share analysis with a leather texture brown background. Two concentric circular charts display competitive market positioning: a 48% orange chart on the left and a 52% black chart on the right, enabling clear data comparison. Text areas adjacent to each chart allow for detailed analysis commentary. The 16:9 widescreen format ensures compatibility with modern presentation environments. Fully editable PPTX format ready for immediate use in business presentations, investor pitches, and competitive analysis reports.
Usage Points
-
Main Usage
Visualize competitive market positioning through dual circular charts, enabling stakeholders to quickly understand market dynamics and competitive landscape. Supports data-driven decision-making in investor presentations, executive briefings, and strategic planning sessions.
-
How to Use
Input actual market share percentages into the left and right circular charts, then add company names and analysis insights in the adjacent text areas. The leather texture background maintains premium aesthetics while ensuring data readability and professional appearance.
-
Recommended For
Marketing professionals, business strategists, investor relations teams, and executives preparing market analysis reports. Ideal for competitive analysis sections, market overview presentations, and quarterly business reviews.
-
Slide Structure
Two-slide layout with identical design: top title area and dual circular chart placement. Slide 2 features a darker background variant. Each chart is independently editable with 4 text input zones: 1 title area, 2 chart description fields, and 1 supplementary text area for additional insights.
Related Products
-

Visualizing Physical Championship Winning Status with Doughnut Chart
#Company Introduction #Market and Competitor Analysis #Graph
-

Performance Achievement Status Illustrated with Doughnut Chart Slide
#Company Introduction #Market and Competitor Analysis #Graph
-

Safety Template Donut Chart – Visualizing Performance and Management
#Company Introduction #Market and Competitor Analysis #Graph
-

Conservation Donut Chart – Visualization of Sustainability
#Company Introduction #Market and Competitor Analysis #Diagram
