Leather Material Map Template - Global Network Visualization
RJ0200021_14
- Last Update 04/03/2025
- File Size 6.4MB
- # of Slides 2
- File Format PPTX
- Slide Ratio 16:9
- Color
Keywords
- #Content-Based Slides
- #Design-Based Slides
- #Company Introduction
- #Financial Plans and Performance
- #Graph
- #Other
- #Global Network
- #Sales and Revenue
- #Column
- #Grouped Column
- #Map
- #16:9
- #world map PowerPoint slide
- #global network presentation
- #regional data visualization
- #world map template
- #international business slide
- #how to create world map in PowerPoint
About the Product
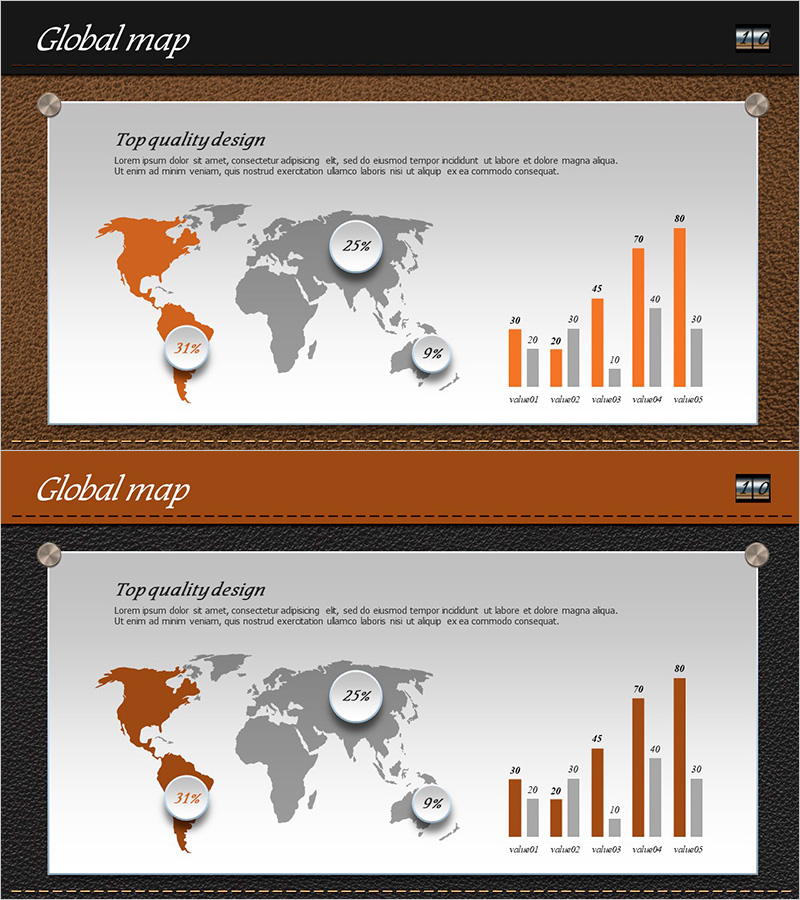
A world map PowerPoint slide that visualizes global networks and regional data at a glance. Four regions—North America, South America, Asia, and Africa—are distinguished in orange and gray, with pie charts displaying regional percentages. A horizontal bar chart on the right compares five data items across two series, making numerical comparisons clear and intuitive. The leather-textured border and neutral background create a professional atmosphere suitable for business presentations. The 2-slide set enables effective communication of global strategies, market analysis, and financial performance across regions.
Usage Points
-
Main Usage
Present global market status, regional sales figures, and international network scale using integrated map and chart visuals. The combination of region-specific colors and numerical data graphs enhances audience comprehension of international business strategy.
-
How to Use
Use in company profile presentations for global business overview sections, investment pitch decks for market analysis pages, and marketing strategy documents for regional planning stages. Edit region names and figures to reflect actual data for immediate presentation use.
-
Recommended For
International business managers, marketing strategists, executives, and investment professionals explaining global expansion plans, regional performance analysis, and international partnerships. Ideal for multinational company quarterly reports and annual business plan presentations.
-
Slide Structure
Both slides feature identical layout: left side displays world map with four color-coded regions (North America, South America, Asia, Africa) each marked with pie charts showing regional percentages; right side shows horizontal bar chart with five items across two data series (orange and gray). Includes title area and descriptive text space at top.
Related Products
-

Visualizing Sales Status of Specific Districts with Horizontal Bar Chart
#Company Introduction #Financial Plans and Performance #Graph
-

Overview of the Global Market Size Supported by a Connected Network Visual
#Company Introduction #Financial Plans and Performance #Other
-

Horizontal Bar Chart Visualizing Market Sales Status
#Market and Competitor Analysis #Financial Plans and Performance #Graph
-

Green Energy Chart Map – Global Market Analysis
#Company Introduction #Market and Competitor Analysis #Graph
