Overview of the Global Market Size Supported by a Connected Network Visual
RJ0300101_4
- Last Update 05/17/2025
- File Size 1.2MB
- # of Slides 2
- File Format PPTX
- Slide Ratio 16:9
- Color
Keywords
- #Content-Based Slides
- #Design-Based Slides
- #Company Introduction
- #Financial Plans and Performance
- #Other
- #Global Network
- #Sales and Revenue
- #Map
- #16:9
- #global market map PowerPoint slide
- #regional market analysis presentation
- #market opportunity visualization
- #3D world map slide deck
- #investor pitch market analysis
About the Product
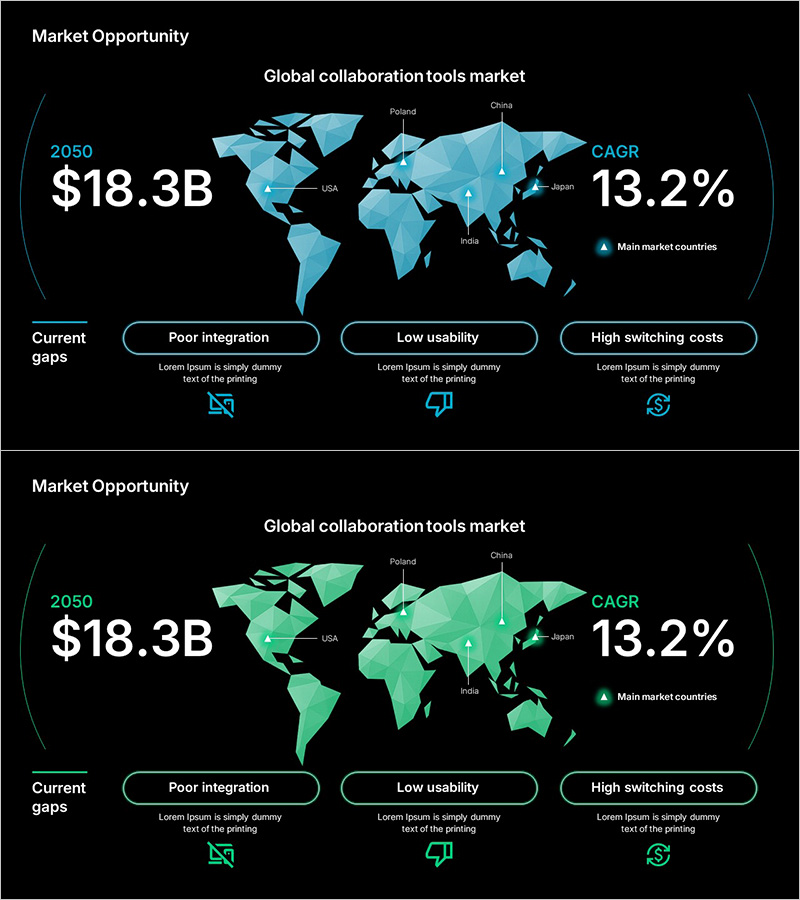
A PowerPoint slide that visualizes the global collaboration tools market size and regional growth opportunities using a 3D world map. Displays the projected 2050 market size ($18.3B), CAGR (13.2%), and distribution across major countries (USA, China, Japan, India, Poland). Current market gaps—Poor integration, Low usability, and High switching costs—are presented with supporting icons. The dual-color design (blue and green versions) enables scenario comparison and competitive analysis. Ideal for investor presentations, market entry strategies, financial performance reports, and data-driven business development discussions.
Usage Points
-
Main Usage
Designed to communicate global market scale, growth rates, and regional distribution at a glance. Supports data-driven decision-making in investor presentations (IR), market entry strategy development, and business opportunity analysis.
-
How to Use
Highlight key countries on the 3D map (USA, China, Japan, India, Poland) while explaining market size and growth potential. Use the two color versions (blue/green) to compare current market conditions with future scenarios, or click on market gap items to add detailed explanations.
-
Recommended For
Executives, investors, business development teams, and marketing strategists presenting global market opportunities. Particularly effective for new market entry announcements, fundraising pitches, and business expansion plans where regional market size and growth potential need visual communication.
-
Slide Structure
Title (Market Opportunity) and subtitle (Global collaboration tools market) at top; left side displays 2050 projected market size ($18.3B) and CAGR (13.2%); center features 3D map visualization; bottom section presents three current gaps (Poor integration, Low usability, High switching costs) with icons.
Related Products
-

Leather Material Map Template - Global Network Visualization
#Company Introduction #Financial Plans and Performance #Graph
-

Visualizing Sales Status of Specific Districts with Horizontal Bar Chart
#Company Introduction #Financial Plans and Performance #Graph
-

Region Display Donut Graph – Infographic for Market Analysis
#Company Introduction #Market and Competitor Analysis #Other
-

Global Map and Learning Icons Slide – Effective Market Analysis
#Company Introduction #Market and Competitor Analysis #Other
