Green Energy Chart Map – Global Market Analysis
RJ0800008_7
- Last Update 08/02/2025
- File Size 1.1MB
- # of Slides 2
- File Format PPTX
- Slide Ratio 16:9
- Color
Keywords
- #Content-Based Slides
- #Design-Based Slides
- #Company Introduction
- #Market and Competitor Analysis
- #Graph
- #Other
- #Global Network
- #Market Status
- #Column
- #Grouped Column
- #Map
- #16:9
- #world map PowerPoint slide
- #global marketing presentation
- #regional data chart
- #world map chart template
- #international market analysis slide
- #map-based graph PowerPoint
- #how to create world map in PowerPoint
About the Product
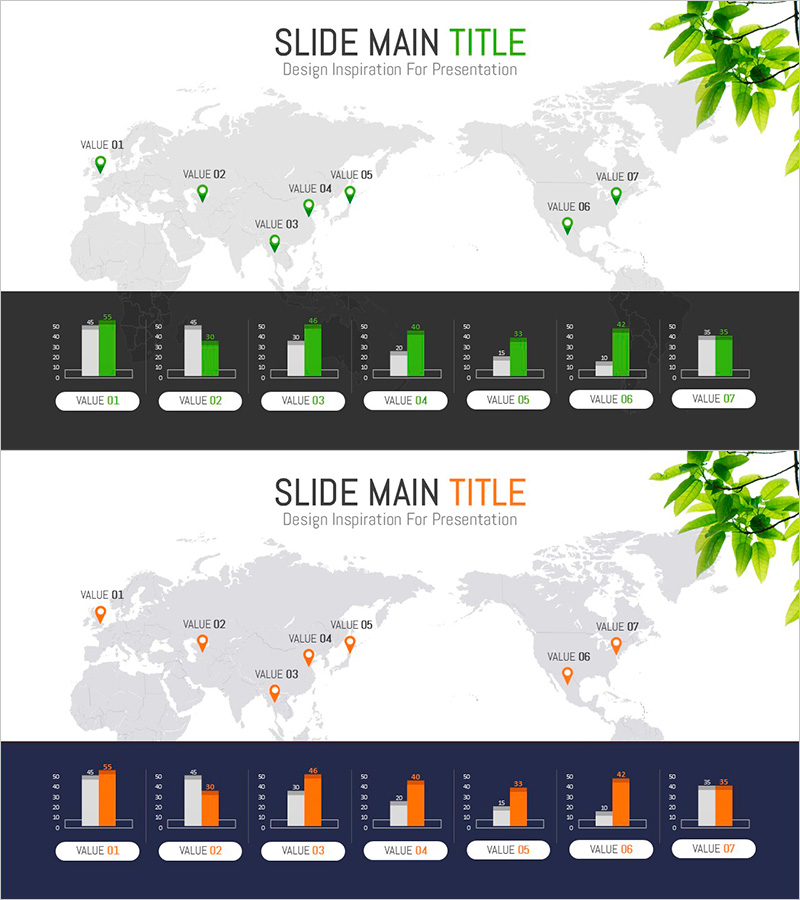
A global market analysis PowerPoint slide combining a world map with comparative bar charts. The upper section displays a world map with seven regional pin markers (VALUE 01–07), while the lower section presents grouped bar charts comparing regional data. The design uses a two-tone color scheme of green and gray to emphasize energy, environment, and growth themes. Optimized for 16:9 widescreen format in a 2-slide set. Instantly applicable for international market entry presentations, regional performance comparisons, and global network introductions across various business contexts.
Usage Points
-
Main Usage
Communicate international market status, regional performance comparisons, and global network scale at a glance. Pin markers on the world map clearly identify regions, while the lower bar chart enables intuitive numerical comparison across locations. Highly effective for investor presentations, executive briefings, and international business pitches.
-
How to Use
Replace VALUE text on the world map with actual region names and input real data values into the lower bar chart. Use green bars for primary metrics and gray bars for comparative indicators, or adjust colors to distinguish categories. Pin marker positions can be repositioned to match your target regions.
-
Recommended For
International business managers, marketing planning teams, executive reporting staff, and global expansion strategy presenters. Particularly useful in energy, environment, IT, finance, and retail sectors when explaining regional performance, market size, and expansion plans.
-
Slide Structure
2-slide set: Slide 1 features world map + 7 regional pin markers + title area. Slide 2 shows the same map + 7 grouped bar charts (2 series each) + regional VALUE labels at the bottom. Optimized for 16:9 widescreen display on projectors and monitors.
Related Products
-

Global Business Market Outlook Circular Diagram
#Company Introduction #Market and Competitor Analysis #Diagram
-

Leather Material Map Template - Global Network Visualization
#Company Introduction #Financial Plans and Performance #Graph
-

Global Area Analysis Bar Graph – Visualization of Market and Competition
#Company Introduction #Market and Competitor Analysis #Graph
-

Global Market Outlook Analysis – Diagram Based Presentation
#Company Introduction #Market and Competitor Analysis #Diagram
