Bar Chart Visualizing Coffee Sales Trends - Insights through Messaging
RJ0600057_13
- Last Update 07/05/2025
- File Size 4.6MB
- # of Slides 2
- File Format PPTX
- Slide Ratio 16:9
- Color
Keywords
- #Content-Based Slides
- #Design-Based Slides
- #Market and Competitor Analysis
- #Financial Plans and Performance
- #Graph
- #Text Box
- #Competitive Advantage
- #Sales and Revenue
- #Horizontal Bar
- #Horizontal Bar Chart
- #Speech Bubble
- #16:9
- #horizontal bar chart PowerPoint
- #bar graph slide template
- #sales comparison chart
- #data visualization PowerPoint
- #how to create bar chart in PowerPoint
About the Product
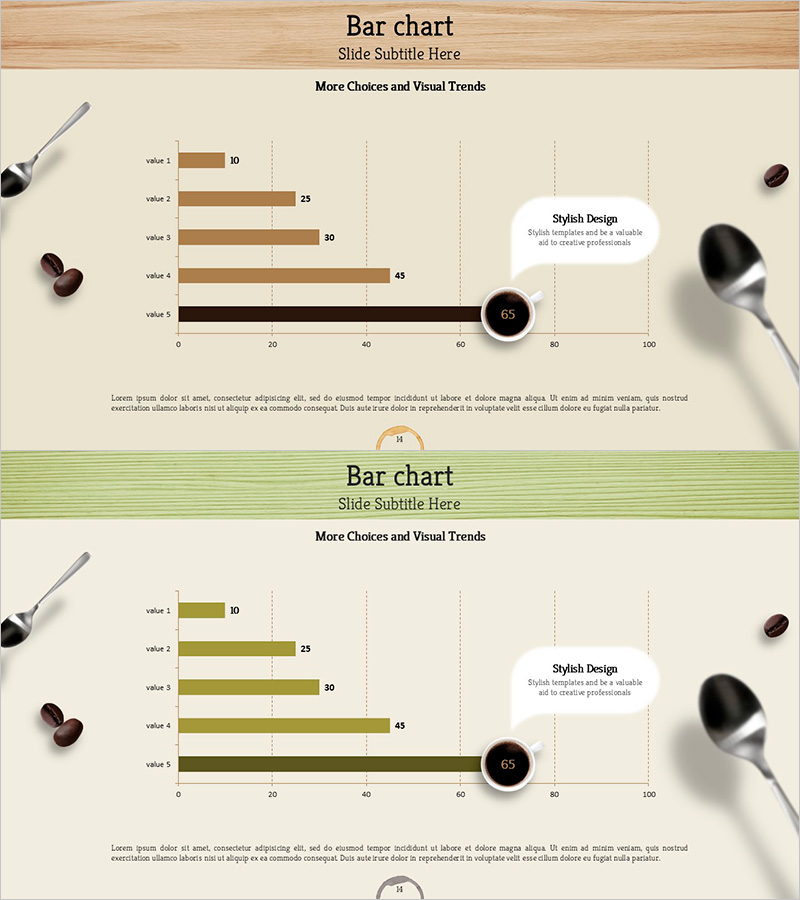
A 2-slide PowerPoint presentation visualizing coffee sales data with 5-item horizontal bar charts. The design features warm color palettes in beige, brown, and olive tones, with numerical values displayed at the end of each bar for precise comparison. A speech bubble text box on the right side provides space to highlight key insights and messaging. Unified with wooden background and coffee-themed imagery, this slide deck is optimized for coffee industry presentations and sales performance reports.
Usage Points
-
Main Usage
Compares multiple data points such as sales volume, revenue, and market share at a glance while emphasizing rankings. Applicable to retail, food, and distribution sectors beyond the coffee industry for performance analysis slides. Bar length enables intuitive comparison and increases audience comprehension.
-
How to Use
Replace bar values with actual data and input key messages or insights in the right-side speech bubble. Colors can be differentiated by category or unified for consistency. Complete the slide by adding contextual descriptions in the bottom text area.
-
Recommended For
Finance professionals, marketing teams, and sales managers presenting quarterly or monthly performance reports. Ideal for investor pitches, executive briefings, team meetings, and industry analysis seminars supporting data-driven decision-making.
-
Slide Structure
2-slide layout. First slide features 5 brown-toned bars (values 10–65), second slide features 5 olive-toned bars with identical structure. Each slide includes one speech bubble text box on the right and description area at bottom. 16:9 widescreen format optimized for modern presentation environments.
Related Products
-

Horizontal Bar Chart for Market Analysis – Trends and Competitive Advantage
#Market and Competitor Analysis #Financial Plans and Performance #Graph
-

Leather Material Presentation Template Horizontal Bar Graph - Sales and Competitive Analysis
#Market and Competitor Analysis #Financial Plans and Performance #Graph
-

Bar Chart Analysis of Cosmetics Trends – Boosting Competitiveness
#Market and Competitor Analysis #Financial Plans and Performance #Graph
-

Design Style Preference Analysis – Insights into Market Competition
#Market and Competitor Analysis #Financial Plans and Performance #Graph
