Bar Chart Analysis of Cosmetics Trends – Boosting Competitiveness
RJ0800039_20
- Last Update 08/11/2025
- File Size 0.6MB
- # of Slides 2
- File Format PPTX
- Slide Ratio 16:9
- Color
Keywords
- #Content-Based Slides
- #Design-Based Slides
- #Market and Competitor Analysis
- #Financial Plans and Performance
- #Graph
- #Competitive Advantage
- #Sales and Revenue
- #Horizontal Bar
- #Horizontal Bar Chart
- #16:9
- #horizontal bar chart PowerPoint
- #bar graph slide template
- #data comparison chart
- #cosmetics market analysis PPT
- #competitive analysis slide
About the Product
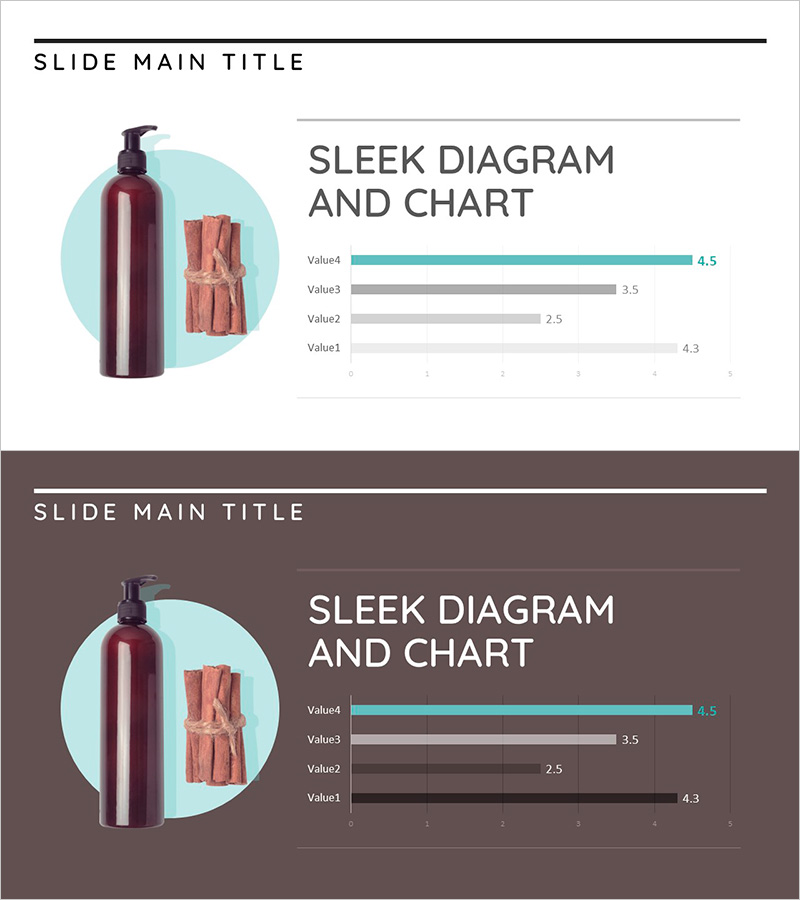
A horizontal bar chart PowerPoint slide optimized for cosmetics market analysis and competitive positioning. Featuring a light blue background with four data items visualized side-by-side, this slide effectively presents product trends, sales performance, market share, and competitive metrics. The 2-slide set includes both light and dark background versions to match your presentation tone. Delivered in 16:9 widescreen PPTX format, fully editable and ready to customize with your own data.
Usage Points
-
Main Usage
Visualize cosmetics and beauty industry metrics—sales figures, product performance, market data—across four comparable items. The horizontal bar format makes numerical comparisons immediately clear, enabling investors, stakeholders, and audiences to grasp competitive advantages and market positioning at a glance.
-
How to Use
Edit each bar length and numerical value to reflect your dataset. Use the light blue version for upbeat, positive presentations and the dark brown version for authority-focused, professional contexts. Customize title, legend, and axis labels to suit various analytical scenarios and reporting needs.
-
Recommended For
Marketing professionals, product managers, and sales teams in cosmetics, beauty, and healthcare sectors presenting market analysis, competitive benchmarking, quarterly performance reviews, product launches, investor pitches, and internal strategy meetings.
-
Slide Structure
Two-slide set with identical data structure presented in contrasting backgrounds: light blue (featuring a light blue circular product illustration on white) and dark brown. Each slide contains four horizontal bars (Value1–Value4) with corresponding numerical values, a title area at the top, and a legend section on the right.
Related Products
-

Horizontal Bar Chart for Market Analysis – Trends and Competitive Advantage
#Market and Competitor Analysis #Financial Plans and Performance #Graph
-

Horizontal Bar Chart for Analyzing Yacht Tour Preference
#Market and Competitor Analysis #Financial Plans and Performance #Graph
-

Sales and Profit Analysis Tables & Graphs – Data-Driven Insights
#Market and Competitor Analysis #Financial Plans and Performance #Diagram
-

Button Bar Chart for Visualizing Sales Status – Competitive Advantage Analysis
#Market and Competitor Analysis #Financial Plans and Performance #Graph
