Market Analysis Bundle Vertical Bar Graph – Visualizing Business Performance
RJ0200019_18
- Last Update 04/02/2025
- File Size 7.3MB
- # of Slides 2
- File Format PPTX
- Slide Ratio 16:9
- Color
Keywords
About the Product
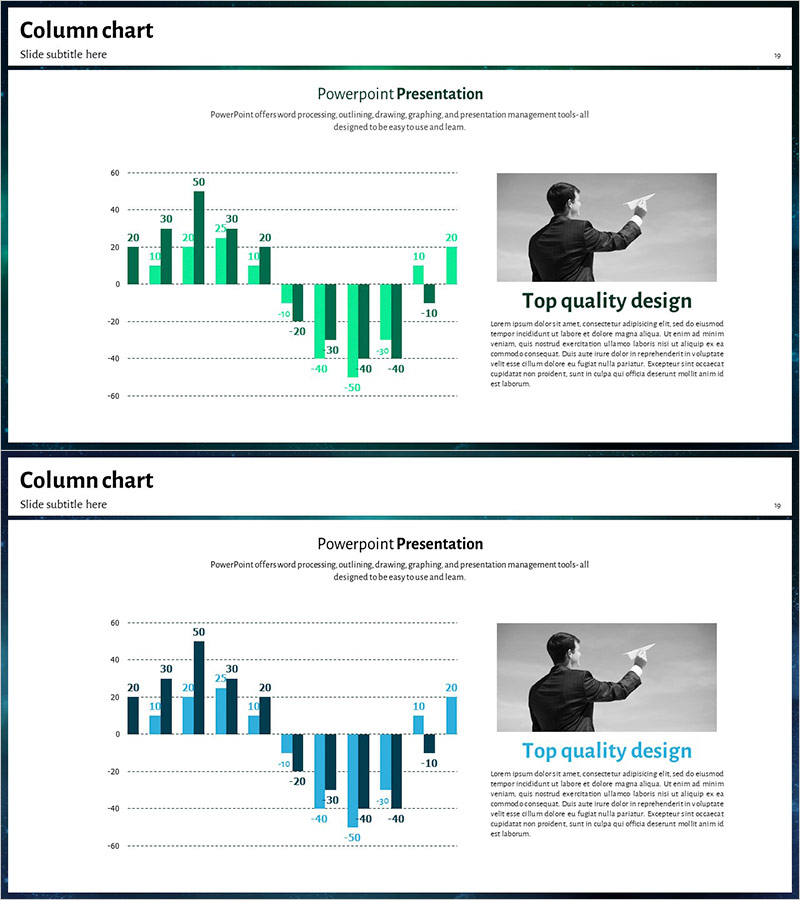
A 2-slide vertical bar chart PowerPoint template optimized for market analysis and business performance visualization. The design uses distinct green and teal color schemes to clearly differentiate positive and negative values, with horizontal gridlines and data labels enabling intuitive numerical comparison. The balanced layout combines a chart area on the left with image and text space on the right, making it ready for immediate use in presentations and reports. Delivered in 16:9 widescreen PPTX format compatible with all presentation environments.
Usage Points
-
Main Usage
Ideal for business presentations requiring simultaneous display of positive and negative metrics such as market analysis, sales performance, and profitability analysis. The green (positive) and teal (neutral) color palette intuitively communicates data meaning, while horizontal gridlines and numerical labels support accurate comparative analysis.
-
How to Use
Input your data into the left chart area and customize the right-side image and text to match your presentation context. The 2-slide layout can be repeated or duplicated to sequentially present multiple metrics. Colors and data labels are fully editable to align with your brand guidelines.
-
Recommended For
Recommended for business analysts, strategists, executives, and marketing professionals preparing executive reports, quarterly performance reviews, market research presentations, financial analysis decks, and marketing performance summaries. Suitable for any data-driven business presentation requiring comparative analysis.
-
Slide Structure
Each slide features a vertical bar chart occupying the left 60% with approximately 10 data points showing mixed positive and negative values, paired with a business professional image, 'Top quality design' heading, and descriptive text in the right 40%. Horizontal gridlines (0, 20, 40, 60 increments) and value labels above each bar enable precise data interpretation.
Related Products
-

Visual Flow Emphasized Slide Design – Perfect Choice for Data Analysis
#Market and Competitor Analysis #Graph #Market Analysis
-

Visual Data Overview of Research Findings – Beginning of Innovation
#Market and Competitor Analysis #Graph #Market Analysis
-

Market Value Proof PowerPoint Slide – Line & Bar Chart Dark
#Business Strategy #Market and Competitor Analysis #Graph
-

Comparative Analysis Vertical Bar Chart – Market and Competitor Analysis
#Market and Competitor Analysis #Graph #Competitor Analysis
