Visual Flow Emphasized Slide Design – Perfect Choice for Data Analysis
RJ0300080_20
- Last Update 05/11/2025
- File Size 3.4MB
- # of Slides 2
- File Format PPTX
- Slide Ratio 16:9
- Color
Keywords
About the Product
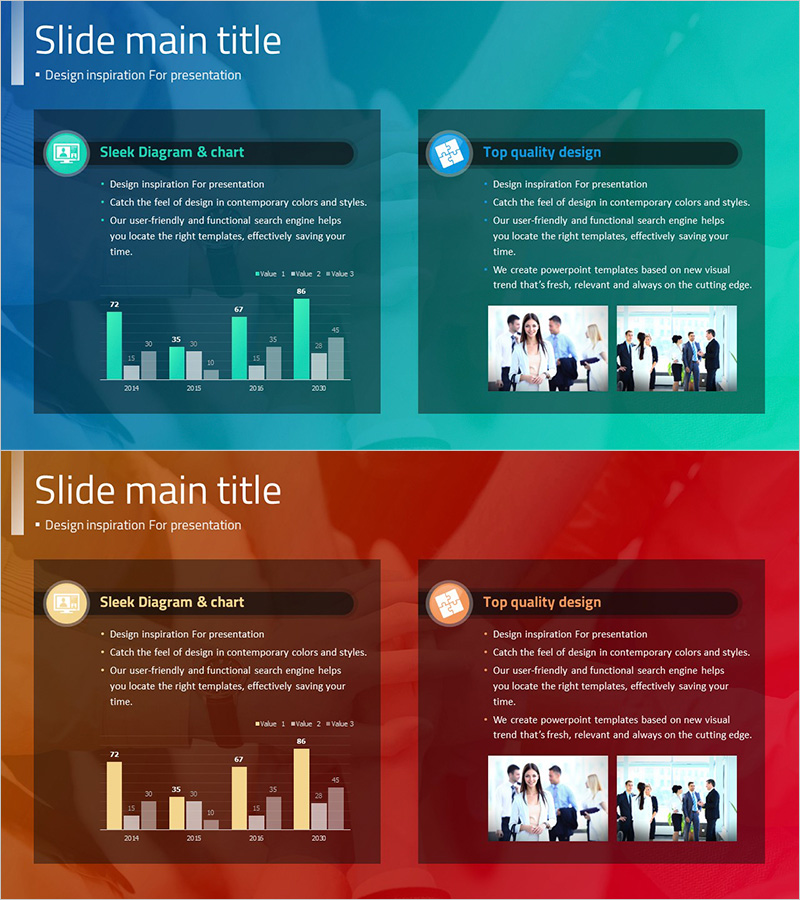
A grouped bar chart PowerPoint slide optimized for data analysis and business performance presentations. The teal gradient background contrasts with mint, gray, and lavender bars to clearly compare four data series across multiple periods. This slide template visualizes year-over-year trends from 2024 to 2027, making it ideal for expressing marketing performance, sales volume, customer satisfaction metrics, and other business indicators. Provided in editable PPTX format, allowing you to customize colors, values, and labels to match your presentation needs.
Usage Points
-
Main Usage
The primary goal is to compare multiple data sets across different periods, departments, or products simultaneously. The grouped structure displays four data series side-by-side, enabling effective trend analysis and performance comparison. Essential for quantitative data-driven presentations such as marketing reports, quarterly earnings calls, product sales comparisons, and strategic performance reviews.
-
How to Use
Open the slide and replace existing values with your own data. Each bar series is color-coded for clarity, making it easy to distinguish between different categories. Customize labels by changing years, department names, or product titles as needed. You can reduce or add data series while maintaining the teal background harmony. Color customization is fully supported to match your corporate branding.
-
Recommended For
Ideal for executives, marketing teams, sales departments, finance teams, data analysts, and consultants who need to report quantitative results. Suitable for quarterly performance reviews, annual business reports, investor presentations, client proposals, and internal strategy meetings.
-
Slide Structure
Two-slide set featuring a grouped bar chart on a teal gradient background. The first slide displays four data series (mint, gray, lavender, beige) across four time periods (2024–2027) in grouped format. The second slide provides an identical layout with warm tones (red and brown) for alternative color schemes.
Related Products
-

Vertical Bar Chart for Future Growth Prediction – Innovative Vision
#Market and Competitor Analysis #Graph #Competitor Analysis
-

Regional Competitive Advantage Chart – Essential Tool for Market and Competitor Analysis
#Company Introduction #Market and Competitor Analysis #Graph
-

PC Mockup & Column Bundle Graph
#Market and Competitor Analysis #Graph #Other
-

Comparative Chart Analysis – Optimized for Market and Competitive Analysis
#Market and Competitor Analysis #Graph #Market Analysis
