Marketing Performance Analysis Chart by Year – Visualizing Market Trends
RM0400014_6
- Last Update 02/19/2025
- File Size 0.3MB
- # of Slides 2
- File Format PPTX
- Slide Ratio 16:9
- Color
Keywords
- #Content-Based Slides
- #Design-Based Slides
- #Market and Competitor Analysis
- #Diagram
- #Graph
- #Market Analysis
- #Industry Trends
- #Table
- #Column
- #Standard Table
- #Grouped Column
- #16:9
- #grouped bar chart PowerPoint
- #marketing performance chart slide
- #year-over-year comparison
- #market analysis graph
- #multi-series bar chart template
About the Product
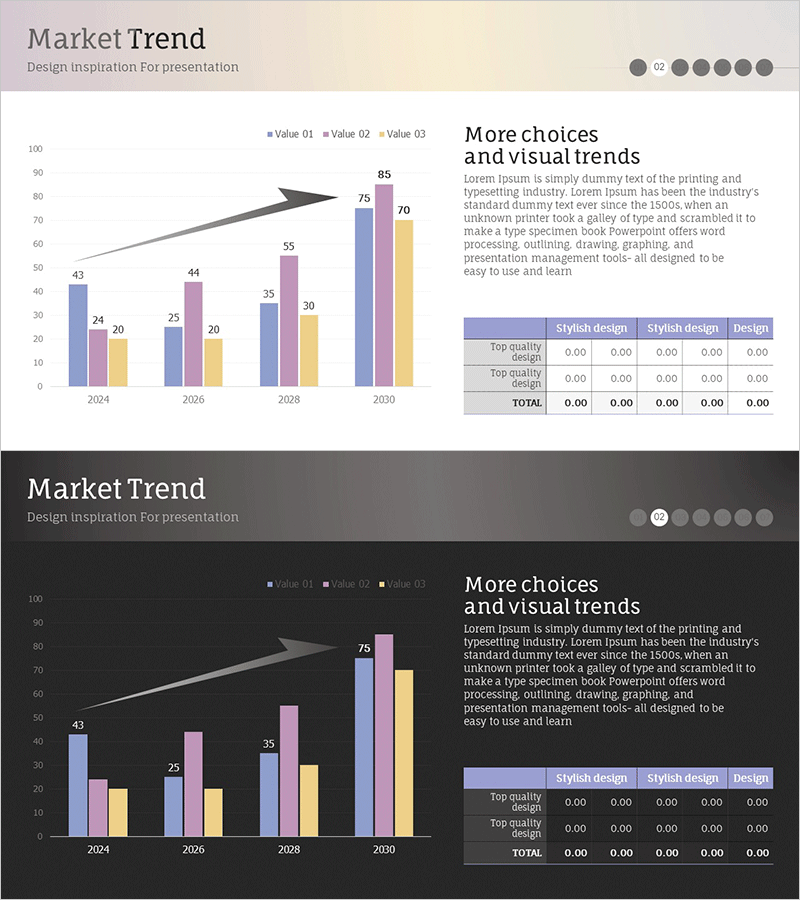
A grouped bar chart PowerPoint slide that visualizes year-over-year marketing performance from 2024 to 2030 across three data series (Value 01, 02, 03). This presentation slide combines horizontal and vertical bar arrangements to display comparative metrics, making it ideal for market trend analysis and performance reporting. The design features a beige and black two-tone background with blue, purple, and yellow color coding for each series, enhanced by an overlaid trend line that emphasizes overall direction. Two versions are provided—light and dark themes—allowing you to select the design that best matches your presentation environment.
Usage Points
-
Main Usage
Designed for visualizing marketing performance analysis, market trend comparison, and year-over-year performance metrics. The three-series format allows simultaneous display of multiple indicators (revenue, customer count, conversion rate, etc.), while the trend line overlay emphasizes overall directional movement.
-
How to Use
Insert into marketing strategy presentations, business reports, and quarterly performance review slides to communicate numerical data intuitively. The bar heights and color differentiation clearly show series-to-series variations, while the trend line reinforces overall trajectory, enhancing audience comprehension.
-
Recommended For
Ideal for marketing professionals, executives, and sales teams presenting quarterly or annual performance results. Particularly effective when comparing multiple channels, products, or regions simultaneously. Also suitable for investor presentations and employee training materials.
-
Slide Structure
Two-slide set with identical data structure presented in light theme (beige background) and dark theme (black background). Left side features a 4-year grouped bar chart (2024–2030), while right side includes a 'More choices and visual trends' text area and data table for additional annotations and value entry.
Related Products
-

Clustered Column Slide Template for Market Trends and Analysis
#Market and Competitor Analysis #Graph #Market Analysis
-

Market Trend Analysis Graph - Market and Competitive Analysis
#Market and Competitor Analysis #Graph #Market Analysis
-

Performance Analysis Table Slide – Market and Competitor Analysis
#Market and Competitor Analysis #Diagram #Graph
-

Graph of Financial Outlook Analysis after Investment Attraction
#Business Introduction #Market and Competitor Analysis #Diagram
