Market Share Analysis Donut Circle Graph – Strengthening Competitiveness
RJ0400018_15
- Last Update 05/22/2025
- File Size 0.3MB
- # of Slides 2
- File Format PPTX
- Slide Ratio 16:9
- Color
Keywords
About the Product
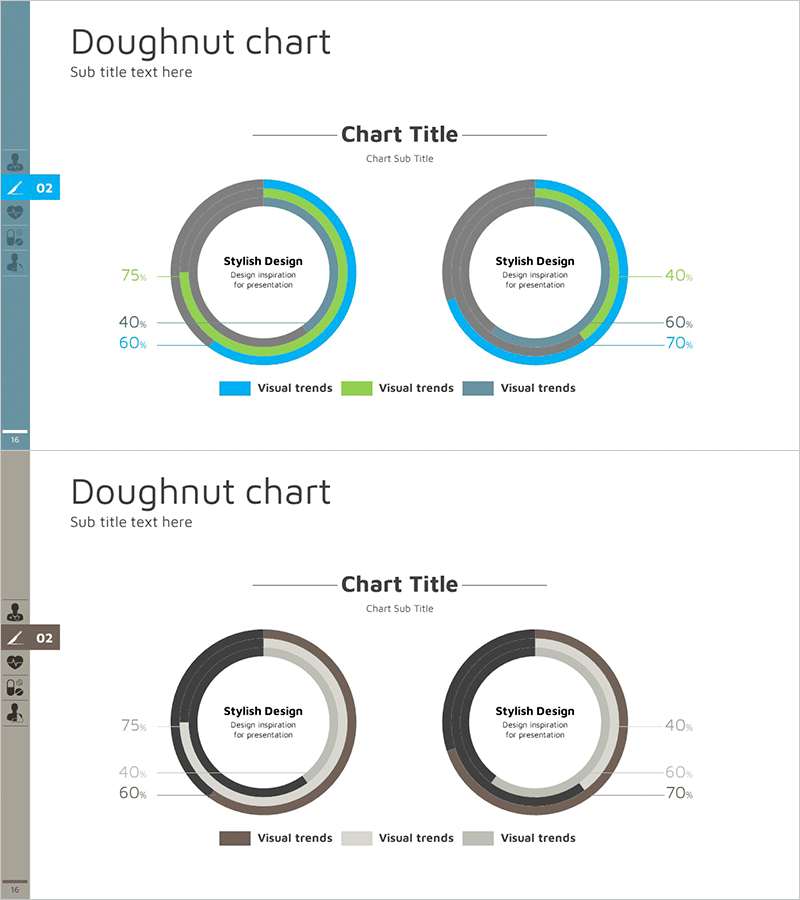
A donut chart PowerPoint slide optimized for market share analysis and competitive comparison. The concentric ring structure with blue, green, and gray series enables simultaneous visualization of multiple data sets. Percentage values are displayed on each donut ring for clear quantitative comparison, while the central text area highlights key messages. The 2-slide set accommodates various presentation scenarios and features a 16:9 widescreen format suitable for modern presentation environments. Provided in fully editable PPTX format.
Usage Points
-
Main Usage
Ideal for comparing multiple data sets such as market share, competitor share, and customer preference ratios simultaneously. The concentric ring structure enables hierarchical data representation, with the central text area emphasizing key insights and findings.
-
How to Use
Replace the donut ring colors and percentage values with your own data. Edit the left-side numerical labels to add item names and use the legend to clarify the meaning of each series. Replace the center 'Stylish Design' text with your key message to complete the slide.
-
Recommended For
Suitable for marketing strategy presentations, executive reports, market analysis seminars, sales presentations, and consulting proposals—particularly in competitive analysis sections. Frequently used in finance, retail, IT, and manufacturing industries where market competition is critical.
-
Slide Structure
2-slide set with 2 donut charts per slide. Each chart features 3 concentric rings (blue, green, gray series) with percentage values displayed on the left (75%, 40%, 60%, 70%, etc.). A central text input area allows insertion of titles or key messages.
Related Products
-

Analysis of Cigarette Types by Situation – Utilizing Doughnut Chart
#Market and Competitor Analysis #Graph #Competitor Analysis
-

Blue Green Progress Visualization – Graph for Achievement Rate
#Product/Service Introduction #Business Strategy #Market and Competitor Analysis
-

Donut Chart Slide for Market Share Analysis
#Market and Competitor Analysis #Graph #Competitor Analysis
-

Market Share Analysis with Donut Charts – Squirrels Theme
#Market and Competitor Analysis #Graph #Market Share
