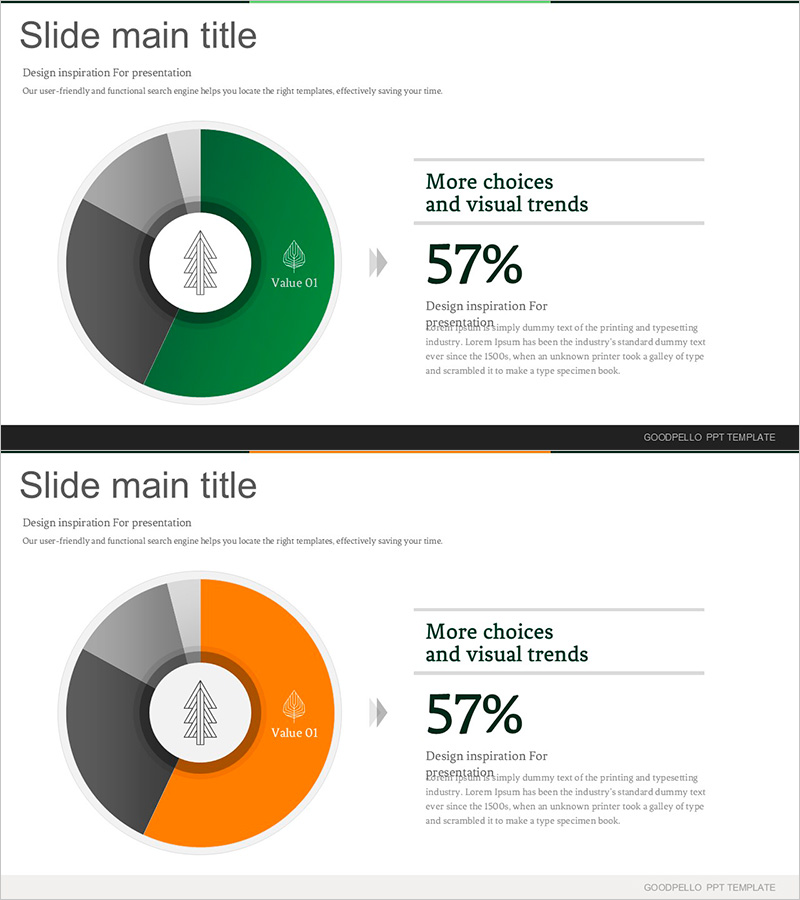
Donut Chart for Forest Preservation Rate – Strategy for Environmental Sustainability
RJ0600091_17
- Last Update 07/15/2025
- File Size 0.1MB
- # of Slides 2
- File Format PPTX
- Slide Ratio 16:9
- Color
Keywords
About the Product
A donut chart PowerPoint slide designed to visualize forest preservation rates and environmental sustainability metrics. The 4-segment composition in green, gray, and orange tones effectively represents market share, business strategy progress, and environmental data ratios. The central circular area accommodates icons and text to emphasize key messages, while the right-side text zone allows for numerical data and detailed descriptions. Formatted in 16:9 aspect ratio with 2 slides, this presentation template is ready for immediate use in business reports and strategy presentations.
Usage Points
-
Main Usage
Optimized for visualizing part-to-whole ratios such as forest preservation rates, market share, and business strategy metrics. The central circular area with icons and key figures draws audience attention and reinforces data-driven messaging.
-
How to Use
Ideal for executive reports, environmental policy presentations, marketing strategy meetings, and investor pitch decks. Each segment color and numerical value can be edited to match your actual data and customize the slide for specific business contexts.
-
Recommended For
Environmental and sustainability officers, marketing strategists, business analysts, corporate development managers, and policy makers who need to present data-driven insights and analytical reports.
-
Slide Structure
4-segment donut chart structure with clearly defined sections. The central circular area displays icons and key percentages (e.g., 57%), while the right side provides space for descriptive text such as 'More choices and visual trends' and additional detailed information.
Related Products
-

Logistics Donut Chart – Performance and Market Shares
#Business Strategy #Market and Competitor Analysis #Diagram
-

Donut Chart Slide for Market & Competitive Analysis – Korea's Representative Image Survey
#Business Strategy #Market and Competitor Analysis #Graph
-

Academic and System Donut Charts – Market Share Analysis
#Business Strategy #Market and Competitor Analysis #Graph
-

Blue Green Progress Visualization – Graph for Achievement Rate
#Product/Service Introduction #Business Strategy #Market and Competitor Analysis
