Volume Template with Doughnut Chart – Market Share Visualization
RJ0200017_5
- Last Update 04/02/2025
- File Size 3MB
- # of Slides 2
- File Format PPTX
- Slide Ratio 16:9
- Color
Keywords
- #Content-Based Slides
- #Design-Based Slides
- #Product/Service Introduction
- #Market and Competitor Analysis
- #Graph
- #Development Status
- #Market Share
- #Circles
- #Doughnut Chart
- #16:9
- #doughnut chart PowerPoint
- #donut chart slide template
- #ratio comparison chart
- #market share visualization
- #two-item data presentation
About the Product
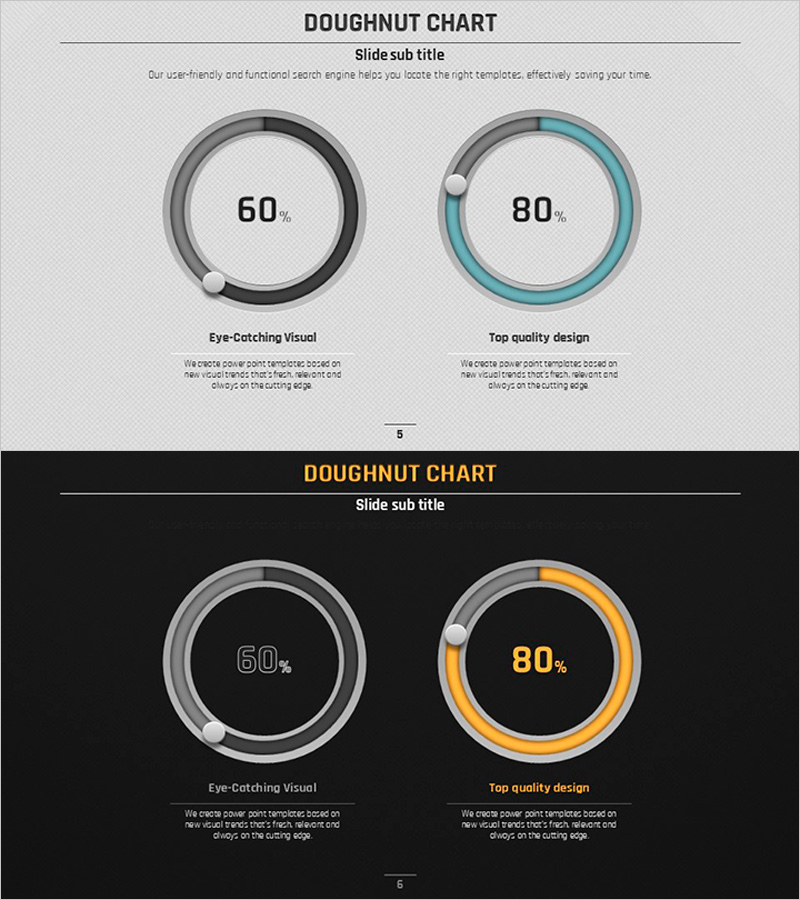
A professional doughnut chart PowerPoint slide template designed to compare ratios of two data items side by side, such as market share, sales distribution, or customer composition. The template includes two design variations: a light gray background version and a dark background version, each featuring distinct color schemes (gray and teal accents on light; gray and orange accents on dark). Percentage values are displayed at the center of each doughnut chart for clear data emphasis. The 16:9 widescreen format includes 2 slides with dedicated text description areas below each chart, allowing you to add context and insights to your presentation seamlessly.
Usage Points
-
Main Usage
This slide is designed to visually compare the proportions or composition of two data categories or items simultaneously. It is ideal for presentations requiring emphasis on relative ratios such as market share, sales distribution, customer demographics, budget allocation, or resource distribution.
-
How to Use
Simply edit the percentage values and colors in each doughnut chart to match your data. Choose the light background version for bright presentation environments or the dark background version for darker venues. Add your analysis and insights in the text description area below each chart to complete the slide.
-
Recommended For
Recommended for executive reports, business performance presentations, marketing analysis decks, investor pitch meetings, and consulting proposals. Ideal for professionals including executives, data analysts, marketers, and consultants who need to emphasize data proportions.
-
Slide Structure
Slide 1: Light gray background with two doughnut charts positioned side by side. Left chart in gray tones, right chart with teal accent color. Percentage values (60%, 80%) centered in each chart. Text description area below each chart. Slide 2: Identical layout with dark background (black) and alternate color scheme (gray and orange accents). Both slides optimized for 16:9 widescreen format with fully editable elements.
Related Products
-

Analysis of Work Progress – Utilizing Pie Chart
#Product/Service Introduction #Market and Competitor Analysis #Graph
-

Business Idea Development Status Graph – Ideas and Growth
#Product/Service Introduction #Market and Competitor Analysis #Graph
-

Graph of Analysis of Transportation Development Status
#Product/Service Introduction #Market and Competitor Analysis #Graph
-

Space Exploration Donut Pie Chart
#Product/Service Introduction #Market and Competitor Analysis #Graph
