Highlighted Line Charts and Tables – Market Analysis and Revenue Forecast
RJ0900005_17
- Last Update 08/16/2025
- File Size 0.8MB
- # of Slides 2
- File Format PPTX
- Slide Ratio 16:9
- Color
Keywords
- #Content-Based Slides
- #Design-Based Slides
- #Business Strategy
- #Market and Competitor Analysis
- #Diagram
- #Graph
- #Financial Outlook & Expected Impact
- #Market Analysis
- #Table
- #Line
- #Line Chart
- #16:9
- #line chart PowerPoint
- #trend analysis slide template
- #dual-series line graph
- #market analysis chart
- #PowerPoint chart slide design
- #how to create line chart in PowerPoint
About the Product
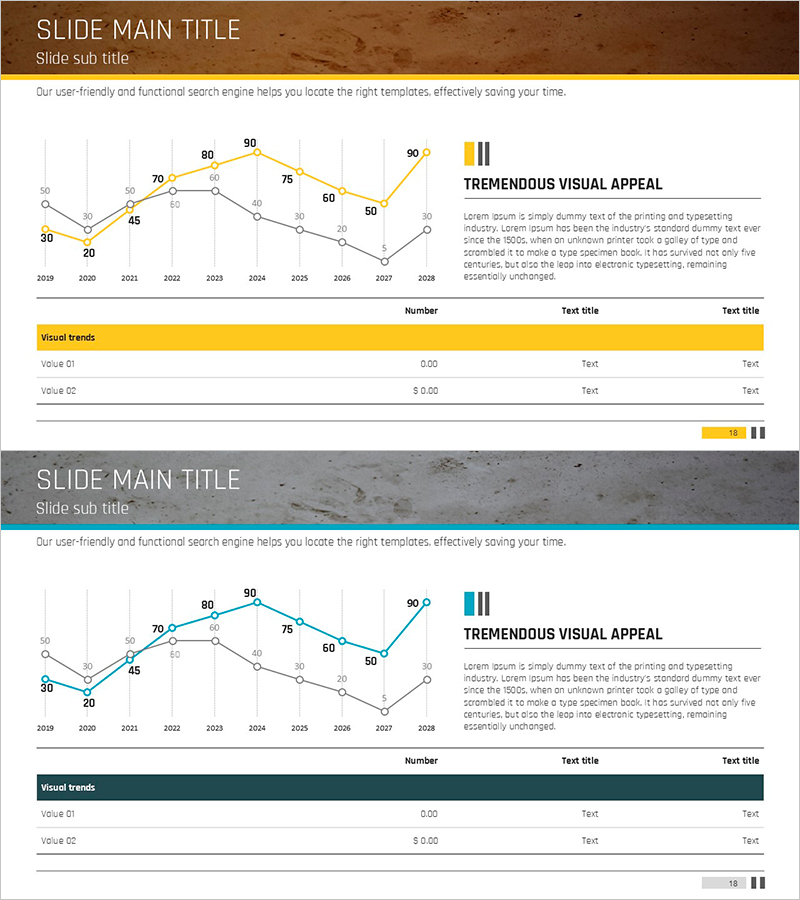
A 2-slide PowerPoint template featuring dual-series line charts for market analysis and revenue forecasting. The line chart displays trends from 2009 to 2028 using yellow and blue data series to compare two metrics over time. The first slide combines the line chart with a bar graph and highlighted text area on the right to emphasize key insights. The second slide adds a data table below the same chart for detailed numerical reference. Ideal for business presentations, investor pitches, financial reports, and strategic planning documents requiring multi-period trend visualization.
Usage Points
-
Main Usage
Visualizes long-term trends and compares multiple data series simultaneously. The line chart clearly shows change patterns over time, while yellow and blue color coding distinguishes between two metrics. Commonly used in executive briefings, investor presentations, and market analysis reports to demonstrate performance trajectories and forecast accuracy.
-
How to Use
Slide 1 combines line chart + bar graph + text emphasis area to present key figures with interpretation. Slide 2 adds a data table below the same chart for detailed numerical values. All elements are fully editable in PowerPoint—modify data points, legend labels, colors, and table entries to match your specific metrics and timeframe.
-
Recommended For
Finance managers, marketing strategists, business analysts, and development teams preparing quarterly/annual performance reports, market trend analysis, revenue projections, and competitive benchmarking. Suitable for business plans, investor pitch decks, executive summaries, marketing strategies, and financial forecasts.
-
Slide Structure
Slide 1: Dual-series line chart (2009–2028, yellow and blue) + 3-item bar graph (upper right) + text highlight box (lower right). Slide 2: Same line chart + data table (3 rows × 3 columns, fully editable). 16:9 widescreen format, PPTX file.
Related Products
-

Future Technology Industry Analysis Graph – Market Trends and Growth Prediction
#Market and Competitor Analysis #Diagram #Graph
-

Green Analysis Chart for Market Overview – Effective Data Comparison
#Market and Competitor Analysis #Diagram #Graph
-

Market Trend Analysis Graph – Visualizing Market Status
#Market and Competitor Analysis #Diagram #Graph
-

Company Financial Status Analysis Chart – Vision for Business Growth
#Business Introduction #Market and Competitor Analysis #Diagram
