Mid-to-Long Term Vision & Growth Strategy Roadmap – Business Advancement Timeline
RJ0300100_4
- Last Update 05/17/2025
- File Size 0.6MB
- # of Slides 2
- File Format PPTX
- Slide Ratio 16:9
- Color
Keywords
- #Content-Based Slides
- #Design-Based Slides
- #Business Strategy
- #Diagram
- #Graph
- #Financial Outlook & Expected Impact
- #Cluster
- #Line
- #Chain Diagram
- #Line Chart
- #Project Progress
- #16:9
- #line chart PowerPoint slide
- #growth trend presentation
- #dual-series comparison chart
- #business strategy roadmap
- #mid-to-long-term vision slide template
About the Product
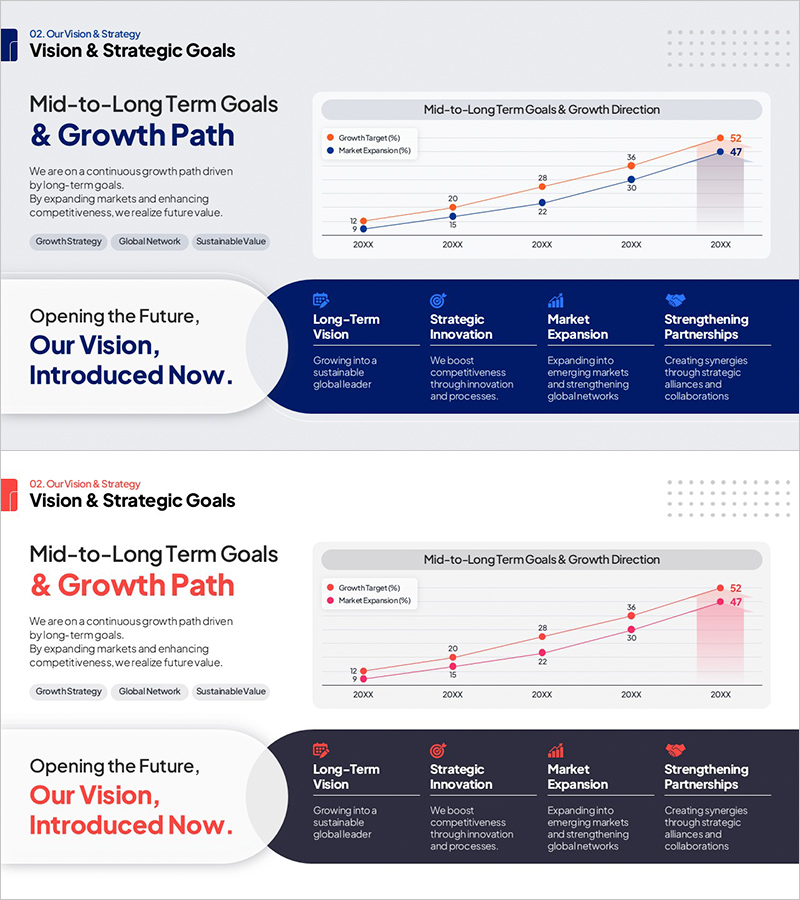
A 2-slide PowerPoint presentation that visualizes mid-to-long-term vision and growth strategy through data-driven design. The line chart displays a 5-year growth trajectory (20XX–20XX) with two data series representing growth targets and market expansion, while the left panel highlights four strategic pillars—Long-Term Vision, Strategic Innovation, Market Expansion, and Strengthening Partnerships—each with supporting icons. The color scheme contrasts navy blue and orange to distinguish data series clearly, and the 16:9 widescreen layout is optimized for executive presentations, business plans, and investor pitch decks.
Usage Points
-
Main Usage
Communicate mid-to-long-term vision and growth strategy to executives, investors, and stakeholders through data visualization. The dual-series line chart enables clear comparison of growth targets and market expansion projections, demonstrating strategy feasibility and expected outcomes at a glance.
-
How to Use
Deploy in executive briefings, business plans, investor relations presentations, and strategic planning meetings to explain long-term growth direction. Customize graph values with your organization's data and adapt the four strategic pillars to reflect your core objectives before presenting.
-
Recommended For
CFOs, CEOs, strategy officers, business development teams, and marketing leaders presenting quarterly performance reviews, new business proposals, and strategic roadmaps. Ideal for situations requiring quantified growth targets and persuasive data-driven narratives.
-
Slide Structure
Slide 1: Title area + left text panel (4 strategic pillars with icons) + right line chart (5 years on X-axis, dual data series with data points). Slide 2: Color variant (navy to orange emphasis) with identical layout. Chart includes axis labels, legend for two series, and gridlines for readability.
Related Products
-

Premium Management Presentation Line Chart – Business Strategy and Revenue Forecast
#Business Strategy #Graph #Financial Outlook & Expected Impact
-

Highlighting Line Graphs in Volume Presentation Template
#Business Strategy #Graph #Financial Outlook & Expected Impact
-

Leather Material Presentation Template Line Chart – Business Strategy
#Business Strategy #Market and Competitor Analysis #Graph
-

Modern Business Presentation Template Line Chart
#Business Strategy #Market and Competitor Analysis #Graph
