Introducing Products and Services with Hexagonal Chart – Achieving Marketing Goals
RJ0200016_16
- Last Update 04/01/2025
- File Size 6.2MB
- # of Slides 2
- File Format PPTX
- Slide Ratio 16:9
- Color
Keywords
About the Product
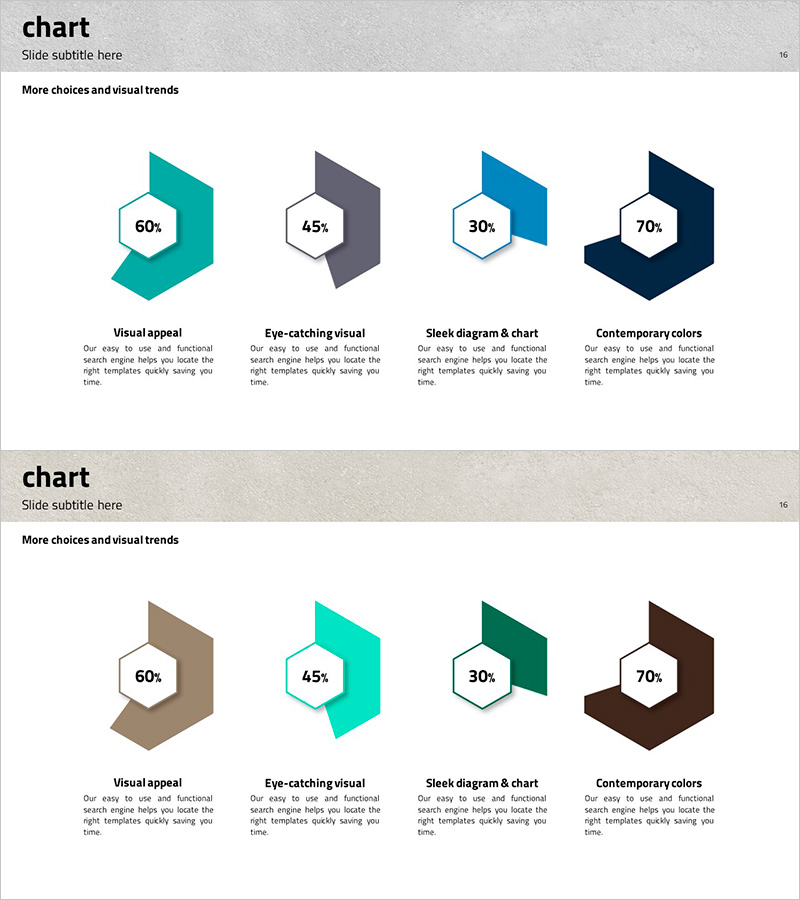
This free PowerPoint slide features four overlapping hexagon shapes arranged in a horizontal row, each displaying a percentage badge at the center along with a title and description text below. Two color themes are included: a cool palette of teal, gray, blue, and navy, and an earthy palette of khaki, teal, deep green, and dark brown, both set against a light gray textured header and white background. The layout is ideal for presenting product or service highlights, marketing KPIs, or key performance metrics in a visually engaging way. Simply replace the percentage values and text to complete your presentation slide. This free PPT slide is fully editable in PowerPoint. For more hexagonal and infographic slides, explore the Free Graph section on GoodPello.
Usage Points
-
Main Usage
Designed to visually compare four product or service highlights, marketing metrics, or performance indicators using overlapping hexagon shapes with percentage badges in a single presentation slide.
-
How to Use
Replace the percentage values in the center badges and update the title and description text beneath each hexagon to match your content. Choose between the two included color themes to align with your brand identity.
-
Recommended For
Ideal for marketers, product managers, startup founders, and business presenters who need to highlight key figures or feature comparisons in company profiles, marketing plans, or product introduction decks.
-
Slide Structure
Single-slide layout with four overlapping hexagon shapes arranged horizontally. Each shape includes a white hexagon percentage badge, a bold title, and a description text area. Two color themes provided: teal-gray-blue-navy and khaki-teal-green-brown.


