Triangle Pattern Rich Line Chart Slide – Market and Strategy Analysis
RJ0200016_13
- Last Update 04/01/2025
- File Size 6.2MB
- # of Slides 2
- File Format PPTX
- Slide Ratio 16:9
- Color
Keywords
- #Content-Based Slides
- #Design-Based Slides
- #Operational Plan
- #Market and Competitor Analysis
- #Marketing Plan and Strategy
- #Graph
- #Risk Management
- #Promotion Strategy
- #Line
- #Line Chart
- #16:9
- #line chart PowerPoint
- #dual-series trend comparison slide
- #data visualization PPT
- #how to create line chart in PowerPoint
- #marketing analysis template
About the Product
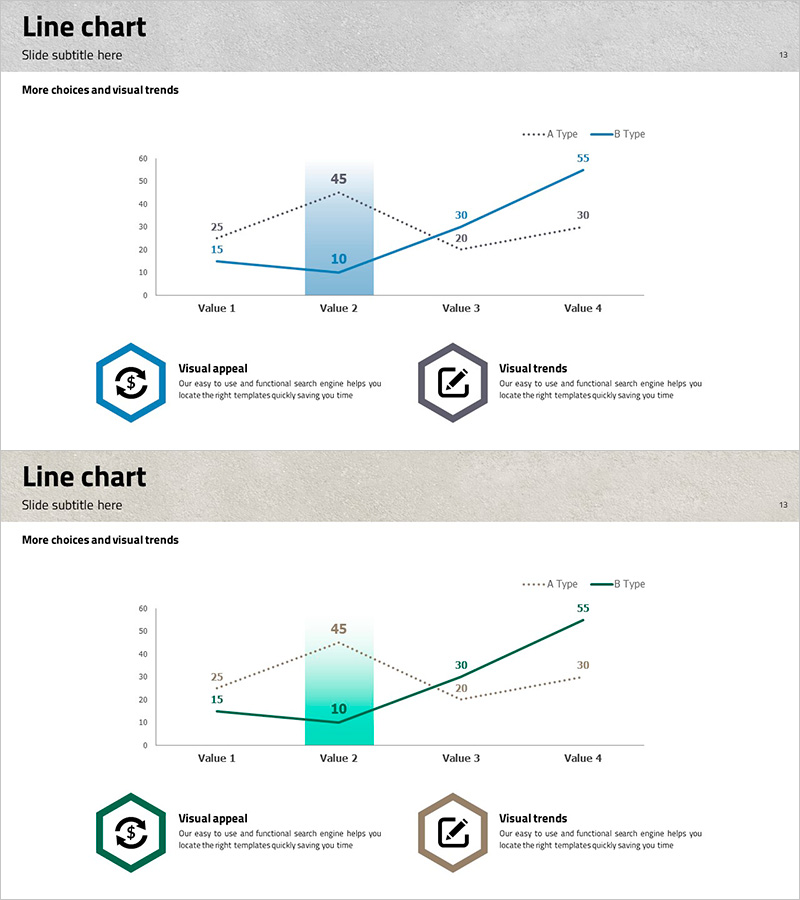
A dual-series line chart PowerPoint slide that visualizes data trends across two distinct categories. The slide features a solid blue line and a dotted line representing Type A and Type B trends across four data points (Value 1 through Value 4). A central teal highlight box emphasizes the key data intersection, while two hexagonal icons on the left (Visual appeal and Visual trends) clarify the slide's purpose. Formatted in 16:9 PPTX, this presentation template is ready for immediate use in marketing strategy, operational planning, and market analysis presentations.
Usage Points
-
Main Usage
Compare and analyze two different metrics or indicators over time in a single visual. Ideal for displaying business KPIs, sales performance comparison, market share evolution, competitive growth rates, or any scenario requiring simultaneous tracking of two related data series.
-
How to Use
Input your actual data directly into the slide or copy and modify existing chart elements to add additional series. Use PowerPoint's built-in chart editing tools to adjust colors, values, and legend labels. Customize the left-side icon text and descriptions to match your presentation context.
-
Recommended For
Marketing teams analyzing campaign performance metrics, sales departments comparing quarterly results, executive reports on market trends, and strategy meetings requiring competitive analysis. Particularly effective when emphasizing correlation or contrast between two variables.
-
Slide Structure
Title area at top, dual-series line chart in center (Y-axis 0–60, X-axis with 4 value points), legend for Type A and Type B, central teal highlight box emphasizing Value 2 intersection, and two hexagonal icons with descriptive text at bottom left. Delivered as a 2-slide PPTX template.
Related Products
-

Paint Splash Template Line Chart - Successful Business Strategy
#Business Strategy #Market and Competitor Analysis #Graph
-

Newspaper Wide PowerPoint Template Line Chart - Market Analysis and Revenue Performance
#Market and Competitor Analysis #Financial Plans and Performance #Graph
-

Trend in the Number of Crimes – Visual Data Analysis
#Business Strategy #Market and Competitor Analysis #Graph
-

Successful Proposition Strategy through Market and Competitive Analysis
#Market and Competitor Analysis #Graph #Market Status
