Trend in the Number of Crimes – Visual Data Analysis
RJ0800010_13
- Last Update 08/02/2025
- File Size 1MB
- # of Slides 2
- File Format PPTX
- Slide Ratio 16:9
- Color
Keywords
- #Content-Based Slides
- #Design-Based Slides
- #Business Strategy
- #Market and Competitor Analysis
- #Graph
- #Achievements
- #Future Outlook
- #Line
- #Line Chart
- #16:9
- #line chart PowerPoint
- #trend data visualization slide
- #time-series graph template
- #dual-series line chart
- #data analysis PowerPoint slide
- #how to create line chart in PowerPoint
About the Product
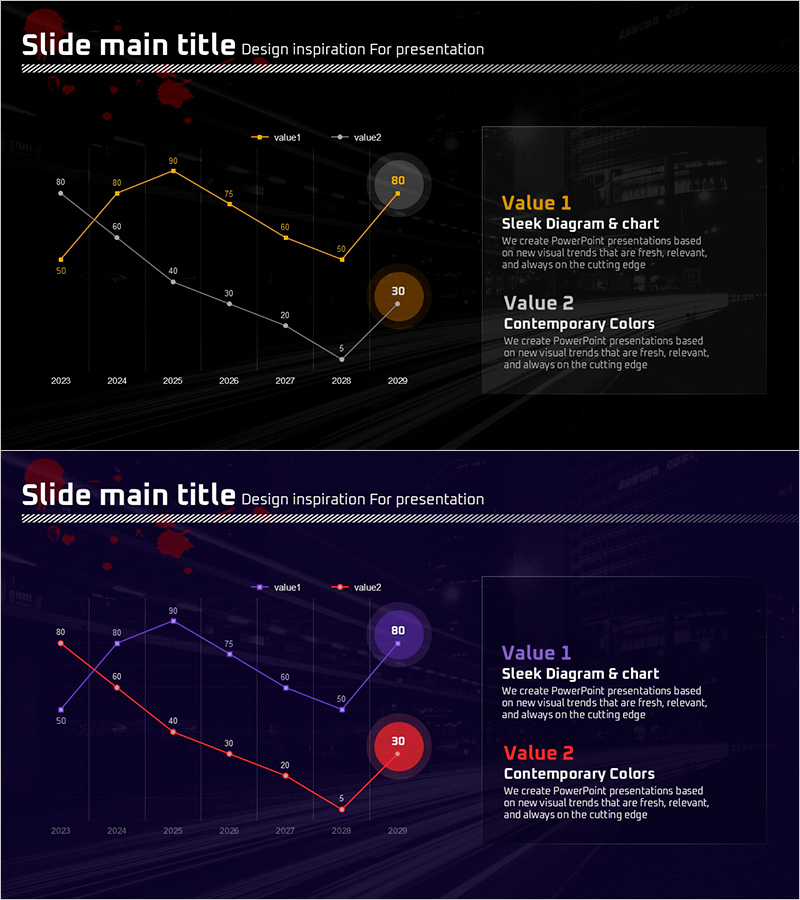
A PowerPoint slide template featuring a dual-series line chart that visualizes time-series data from 2023 to 2029. Two data lines in orange and white tones track changes across eight years, with numeric labels at each data point for precise value comparison. Key metrics (80, 30) are highlighted in circular badges on the right side. Set against a dark technical background, this presentation slide is ready for immediate use in reports, analyses, and business presentations.
Usage Points
-
Main Usage
Compares changes in two or more data series over time. Ideal for presenting sales trends, performance metrics, market dynamics, statistical data, and long-term patterns that require clear visual comparison and pattern recognition.
-
How to Use
Replace the data points and numeric labels with your actual data values. Customize the line colors (orange and white) to match your organization's brand palette. Modify the year range and legend text to fit your specific presentation context.
-
Recommended For
Recommended for executives, analysts, planners, marketers, researchers, and consultants presenting quarterly reports, performance reviews, market analysis, statistical findings, academic presentations, and consulting proposals where data trends must be communicated persuasively.
-
Slide Structure
Two-slide set. First slide features a dark background with dual-series line chart (8 data points), two circular metric badges (80, 30) on the right, and legend. Second slide offers an alternative design variation with modified background color and badge placement while maintaining the same data structure.
Related Products
-

War and Broken Line Graph – Market and Competitor Analysis Strategy
#Business Strategy #Market and Competitor Analysis #Graph
-

Trends in Flower Market Size – Data-Driven Insights
#Business Strategy #Market and Competitor Analysis #Graph
-

Analysis of Drug Efficacy Trends by Year – Data-Driven Business Strategy
#Business Strategy #Market and Competitor Analysis #Graph
-

Orange Green Rising Numerical Graph – Performance and Future Outlook
#Business Strategy #Market and Competitor Analysis #Graph
