Modern Business Plan Presentation Template Bubble Diagram – Efficient Planning Visualization
RJ0200015_19
- Last Update 04/01/2025
- File Size 5.2MB
- # of Slides 2
- File Format PPTX
- Slide Ratio 16:9
- Color
Keywords
- #Content-Based Slides
- #Design-Based Slides
- #Business Strategy
- #Diagram
- #Graph
- #Financial Outlook & Expected Impact
- #Table
- #Column
- #Horizontal Table
- #Grouped Column
- #Project Progress
- #16:9
- #bubble diagram PowerPoint slide
- #speech bubble diagram template
- #business plan visualization slide
- #comparison analysis diagram
- #data representation PowerPoint template
About the Product
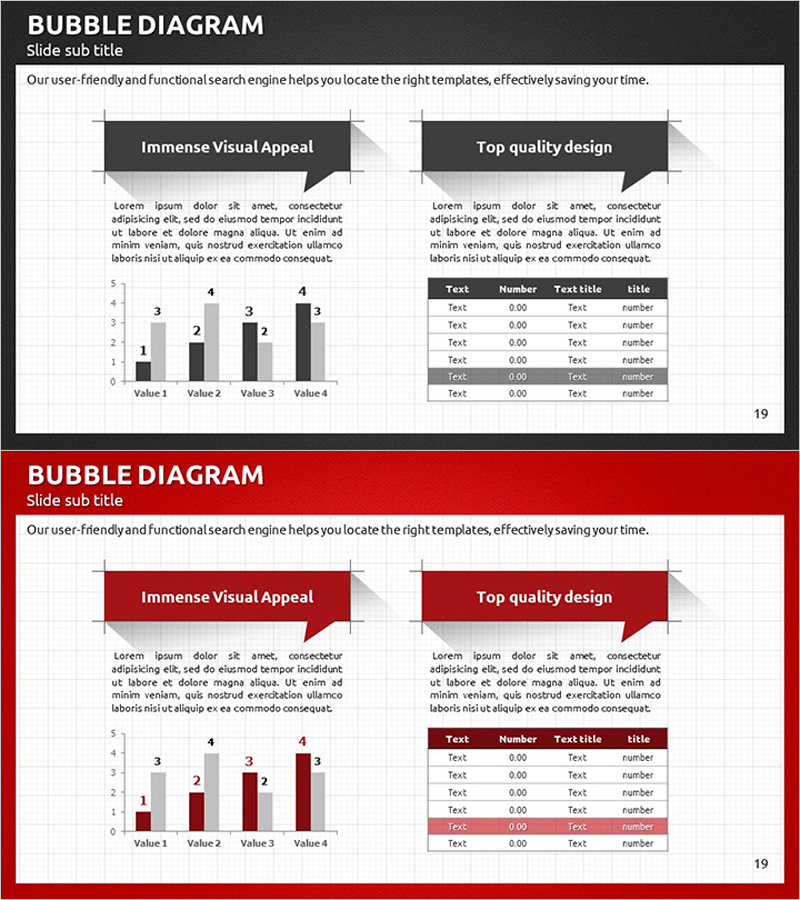
A professional bubble diagram PowerPoint slide designed to visualize business plans and strategic initiatives. This slide combines two speech bubble callouts for key messaging with a bar chart and data table below, enabling efficient information organization. Available in two color versions—dark gray and red—optimized for 16:9 widescreen presentations. The layout integrates text-based insights with numerical data, making it ideal for business reports, strategy presentations, performance reviews, and executive briefings. All elements are fully editable and ready for immediate use.
Usage Points
-
Main Usage
This diagram is designed to present business plan elements and performance metrics simultaneously. The two speech bubble callouts allow for key messaging, while the bar chart and data table below provide quantitative support. It effectively bridges qualitative explanations and numerical data, making it suitable for strategy presentations, business progress reports, and performance analysis.
-
How to Use
Enter core messages or strategic initiatives in the speech bubble text areas. Input numerical data into the bar chart below and populate the data table with detailed information. Choose between the dark gray or red color version based on your presentation theme and corporate branding to maximize visual impact.
-
Recommended For
Executive briefings, business plan presentations, strategic planning meetings, performance analysis reports, investor pitch decks, and departmental progress updates. Particularly effective when communicating both qualitative insights and quantitative metrics. Widely used by consulting firms, financial institutions, and corporate planning teams.
-
Slide Structure
The slide features two speech bubble callouts at the top (each accommodating 100–150 characters), a vertical bar chart in the lower left (4 data points), and a 5-row by 4-column data table in the lower right. The two-column layout maintains visual balance and establishes clear information hierarchy across the slide.
Related Products
-

Progress and Profit Outlook Graph – Harmony of Green and Orange
#Business Strategy #Graph #Financial Outlook & Expected Impact
-

Simple Circle Presentation Template for Column Chart – Clearly Demonstrating Business Performance
#Business Strategy #Graph #Financial Outlook & Expected Impact
-

Profit Forecast and Progress Graph – Harmony of Blue and Orange
#Business Strategy #Graph #Financial Outlook & Expected Impact
-

Blue Line Wide Template Vertical Bar Chart – Ideal for Business Strategy
#Business Strategy #Marketing Plan and Strategy #Graph
