Simple Circle Presentation Template for Column Chart – Clearly Demonstrating Business Performance
RJ0200013_7
- Last Update 04/01/2025
- File Size 0.9MB
- # of Slides 2
- File Format PPTX
- Slide Ratio 16:9
- Color
Keywords
- #Content-Based Slides
- #Design-Based Slides
- #Business Strategy
- #Graph
- #Financial Outlook & Expected Impact
- #Column
- #Grouped Column
- #Project Progress
- #16:9
- #vertical column chart PowerPoint
- #dual series bar chart presentation
- #business performance comparison slide
- #data visualization PowerPoint template
- #how to create column chart in PowerPoint
About the Product
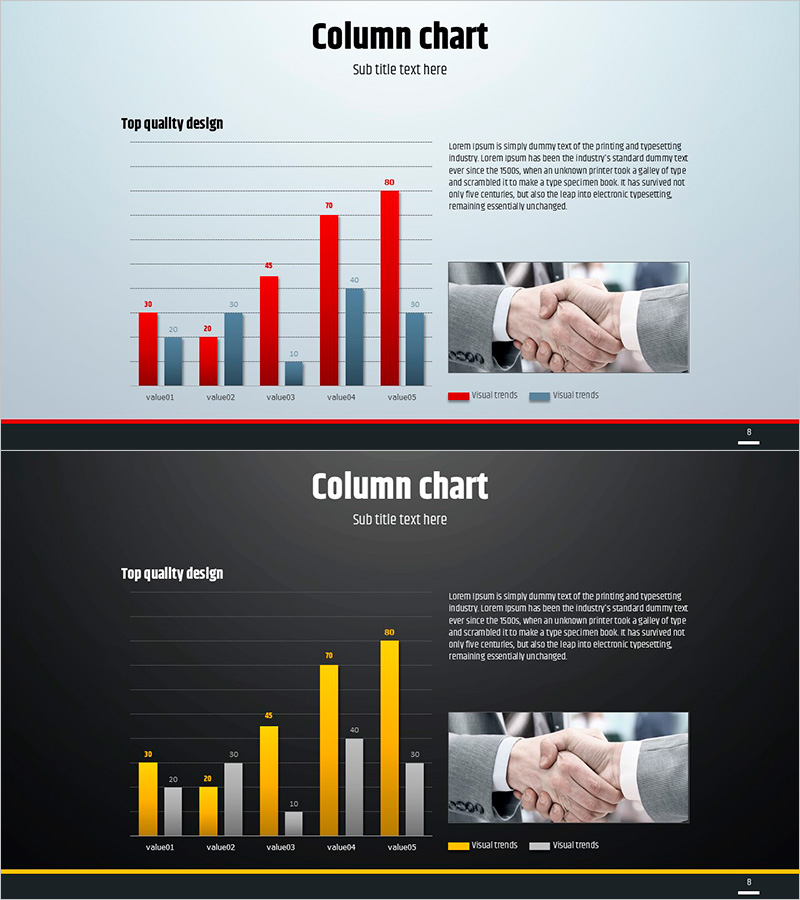
A vertical column chart PowerPoint slide designed to clearly compare business performance and project progress metrics. The slide features a light gray background with red and gray dual-series bars arranged side-by-side for five data points (value1 through value5), enabling intuitive visual comparison of quantitative results. The dual-bar structure allows simultaneous display of actual performance versus targets, or year-over-year comparisons. This presentation slide template is ready to use in executive reports, business performance reviews, quarterly updates, and strategic planning presentations.
Usage Points
-
Main Usage
Display business performance indicators and goal achievement metrics side-by-side for executive briefings, project status updates, quarterly and annual performance analysis. The dual-bar format enables direct comparison of actual results versus targets, or current period versus prior period data.
-
How to Use
Replace value1 through value5 labels and numerical data with your actual metrics. Assign the red series to primary performance data and gray series to comparison data (targets, plans, or prior periods). Clearly label the legend so audiences immediately understand the meaning of each data series.
-
Recommended For
CFOs, financial managers, business unit directors, marketing professionals, management reporting specialists, consultants, and analysts presenting quantitative performance comparisons. Ideal for business plans, quarterly reports, investor presentations, and internal management meetings.
-
Slide Structure
Title area (Column chart) + subtitle + 5-item vertical bar graph with dual series (red and gray) + legend + right-side text area + business image (handshake photo). 16:9 widescreen format, 2-slide set with light and dark background versions.
Related Products
-

Modern Business Plan Presentation Template Bubble Diagram – Efficient Planning Visualization
#Business Strategy #Diagram #Graph
-

Profit Forecast and Progress Graph – Harmony of Blue and Orange
#Business Strategy #Graph #Financial Outlook & Expected Impact
-

Progress and Profit Outlook Graph – Harmony of Green and Orange
#Business Strategy #Graph #Financial Outlook & Expected Impact
-

IT Service Business Progress and Outlook – Roadmap to Success
#Business Strategy #Market and Competitor Analysis #Graph
