Progress and Profit Outlook Graph – Harmony of Green and Orange
RJ0400024_17
- Last Update 05/24/2025
- File Size 2.3MB
- # of Slides 2
- File Format PPTX
- Slide Ratio 16:9
- Color
Keywords
About the Product
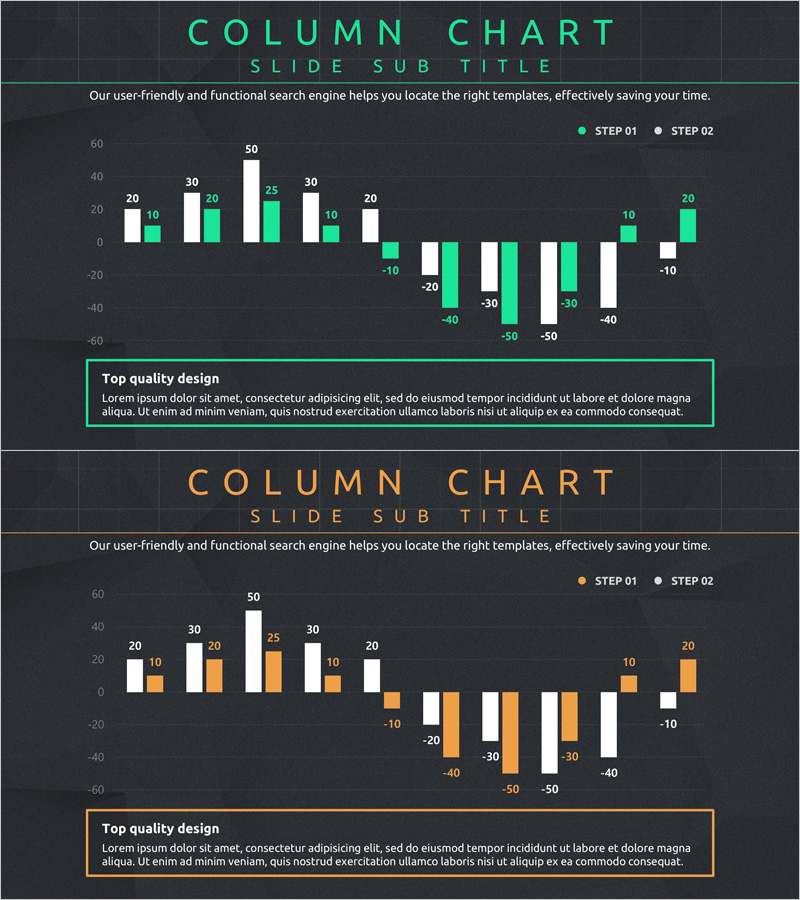
A grouped horizontal bar chart PowerPoint slide designed to visualize business progress and profit outlook with dual-series data comparison. The slide features a dark background with green and orange bar series arranged side-by-side, enabling clear step-by-step numerical analysis. Supporting both positive and negative values, this chart effectively communicates various business metrics including growth rates, profit-loss analysis, and actual versus target performance. The 16:9 widescreen 2-slide set is ready to integrate into presentations, reports, and business plans.
Usage Points
-
Main Usage
Visualizes business progress and profit outlook through step-by-step comparative analysis. The dual-series format displays growth trends, profit-loss changes, and target-versus-actual performance metrics simultaneously for comprehensive data interpretation.
-
How to Use
Input numerical values for each step into the green (STEP 01) and orange (STEP 02) bars to create comparative analysis materials. Integrate into business reports' performance sections, investment pitch decks' results analysis pages, or marketing plans' market analysis charts.
-
Recommended For
Ideal for business managers, financial analysts, marketing planners, and executives preparing performance reports. Suitable for quarterly performance comparisons, year-over-year growth analysis, regional or departmental target achievement evaluations, and multi-metric business assessments.
-
Slide Structure
Two-slide set featuring grouped horizontal bar charts with green and orange series. Displays approximately 15 data points supporting both positive and negative values. Includes a text box at the bottom for adding analytical insights and key takeaways.
Related Products
-

Modern Business Plan Presentation Template Bubble Diagram – Efficient Planning Visualization
#Business Strategy #Diagram #Graph
-

Profit Forecast and Progress Graph – Harmony of Blue and Orange
#Business Strategy #Graph #Financial Outlook & Expected Impact
-

Simple Circle Presentation Template for Column Chart – Clearly Demonstrating Business Performance
#Business Strategy #Graph #Financial Outlook & Expected Impact
-

Visualizing Product Sales Performance and Future Outlook with Horizontal Bar Chart
#Business Strategy #Financial Plans and Performance #Graph
