Visualizing Bicycle Performance with Donut Chart
RJ0600013_5
- Last Update 06/24/2025
- File Size 1.7MB
- # of Slides 2
- File Format PPTX
- Slide Ratio 16:9
- Color
Keywords
- #Content-Based Slides
- #Design-Based Slides
- #Company Introduction
- #Product/Service Introduction
- #Graph
- #Key Achievements
- #Development Status
- #Circles
- #Doughnut Chart
- #16:9
- #donut chart PowerPoint slide
- #pie chart presentation template
- #ratio comparison slide
- #performance visualization PPT
- #circular chart download
About the Product
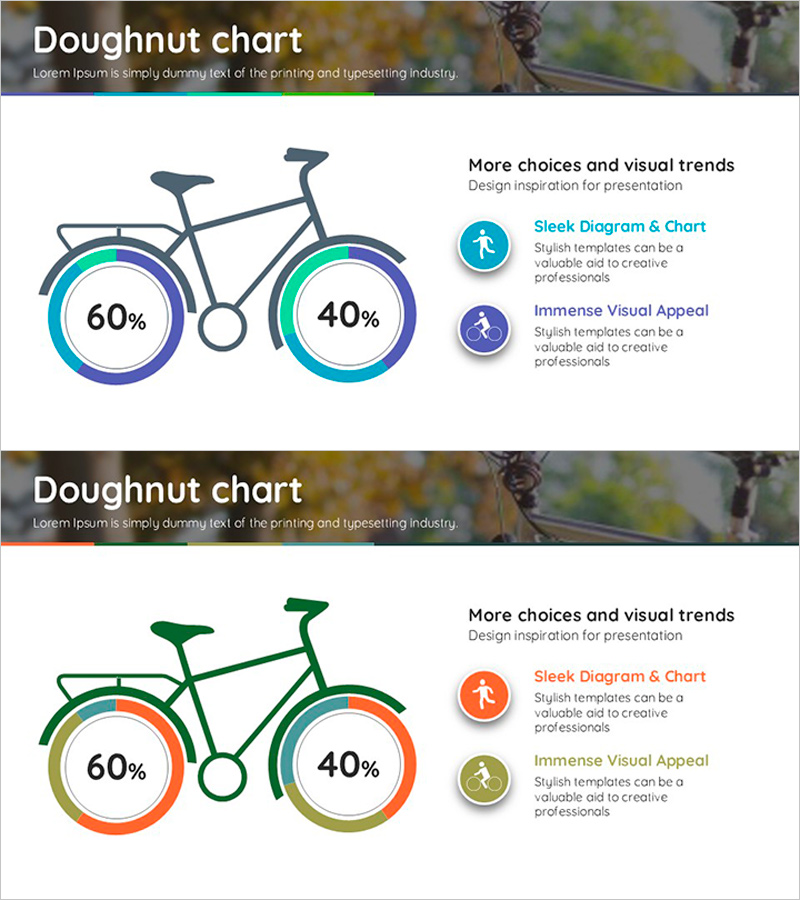
A PowerPoint slide combining bicycle illustration with donut chart visualization. This presentation template displays a 60% vs 40% ratio using gradient-filled circular charts in blue-green and green-orange color schemes. The 2-slide set offers color variations to match your presentation theme. Perfect for comparing performance metrics, market share, goal achievement rates, and other dual-factor data in business reports, marketing analysis, and investor presentations. Fully editable text and data fields allow quick customization for your specific content.
Usage Points
-
Main Usage
Visualize two-factor performance comparison using donut chart design. The 60% vs 40% structure effectively communicates market share, goal achievement, performance analysis, and comparative metrics. Paired with bicycle illustration, it's especially suited for transportation, sports, and lifestyle industry presentations.
-
How to Use
Use in business performance reports, marketing analysis presentations, investor pitch decks, and quarterly reviews. Edit slide text and data values to match your specific metrics. Choose between two color variations (blue-green or green-orange) to align with your presentation theme and brand guidelines.
-
Recommended For
Business analysts, marketing managers, project managers, and sales executives presenting performance comparison data. Ideal for transportation, sports, health, and lifestyle industry reports. Recommended for market research presentations, quarterly performance reviews, and competitive analysis slides.
-
Slide Structure
2-slide set with consistent layout: bicycle illustration on left side and donut chart on right side. Each donut chart features a large circular chart (60% and 40% segments) with gradient fill and legend/description text area. Two color variations provided: blue-green gradient and green-orange gradient for flexible theme matching.
Related Products
-

Ability Donut Chart for Performance Visualization – Emphasizing Key Achievements
#Company Introduction #Product/Service Introduction #Graph
-

Little Witch and Donut Chart – Visualizing Achievements in Presentation Slide
#Company Introduction #Product/Service Introduction #Graph
-

Hologram Donut Chart PPT for Visualizing Key Achievements
#Company Introduction #Product/Service Introduction #Graph
-

Donut Diagram Visualizing Technology Development Status
#Company Introduction #Product/Service Introduction #Diagram
