Simple Circle Template – Horizontal Segmentation Graph
RJ0200013_31
- Last Update 04/01/2025
- File Size 0.4MB
- # of Slides 2
- File Format PPTX
- Slide Ratio 16:9
- Color
Keywords
- #Content-Based Slides
- #Design-Based Slides
- #Market and Competitor Analysis
- #Graph
- #Market Status
- #Market Share
- #Horizontal Bar
- #Segmented Horizontal Bar
- #16:9
- #circular segment chart PPT
- #4-segment pie chart slide
- #horizontal ratio graph
- #market share PowerPoint
- #segmentation chart template
- #data comparison slide
About the Product
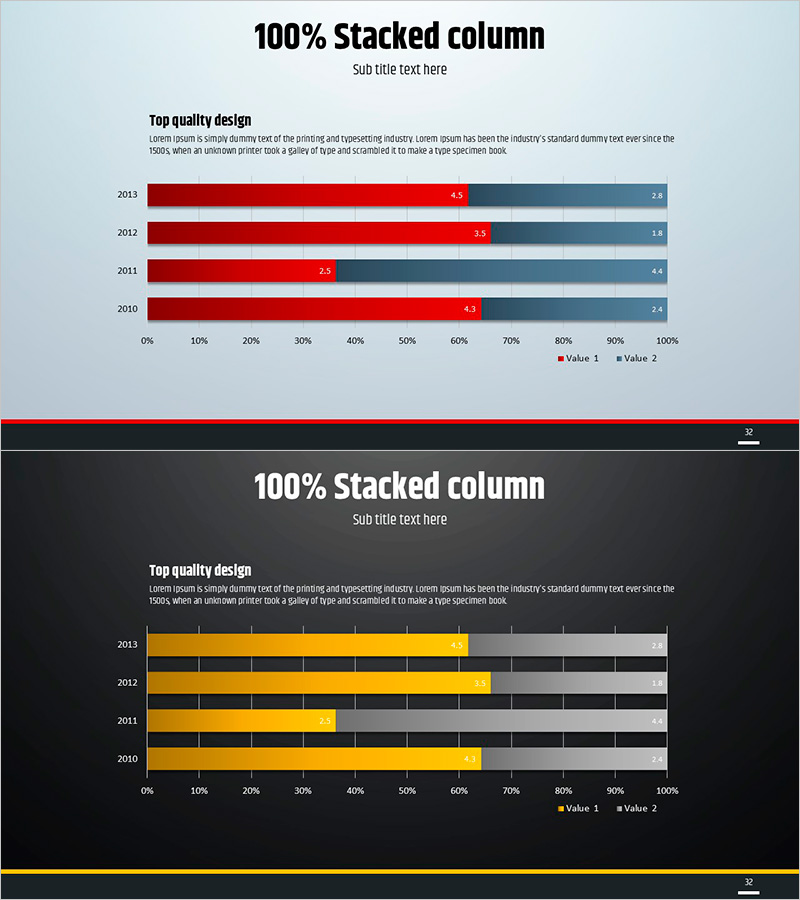
A horizontal segmentation graph PowerPoint slide that displays market share, revenue composition, customer distribution, and other 4-item ratios at a glance. The design features a red and gray two-tone background with circular pie charts and numerical data labels positioned side by side for clear quantitative communication. The 2-slide set provides both light and dark background options, allowing you to match your presentation's tone and style. Delivered in editable PPTX format for quick data input and customization.
Usage Points
-
Main Usage
Ideal for expressing ratio data across four categories such as market analysis, revenue breakdown, customer segmentation, and budget allocation. The combination of pie charts and numerical labels enables simultaneous delivery of both qualitative and quantitative information.
-
How to Use
Use in market analysis sections of business reports, business composition slides in investor presentations, and target customer distribution pages in marketing plans. Double-click each segment value to instantly update with your own data, and colors are fully customizable.
-
Recommended For
Recommended for finance professionals, marketing managers, business planners, and consultants who require data-driven presentations. Particularly effective for quarterly performance reports, new business proposals, and customer analysis presentations.
-
Slide Structure
2-slide set. Slide 1 features a light gray background with red pie chart segments and numerical labels. Slide 2 provides the same structure with a dark background and yellow pie chart. 16:9 widescreen format, PPTX file type.
Related Products
-

Red Green Detail Analysis Chart – Visualizing Market Share
#Market and Competitor Analysis #Graph #Market Status
-

Market Status and Share Graph – Harmony of Blue and Orange
#Market and Competitor Analysis #Graph #Market Status
-

Market Status and Share Analysis Slide – The Harmony of Blue and Orange
#Market and Competitor Analysis #Graph #Market Status
-

Visualizing Market Share and Status with Pie Chart
#Market and Competitor Analysis #Graph #Market Status
