Technology Service Market Trends and Status – 100% Stacked Bar Chart
RJ0400027_17
- Last Update 05/25/2025
- File Size 2MB
- # of Slides 2
- File Format PPTX
- Slide Ratio 16:9
- Color
Keywords
- #Content-Based Slides
- #Design-Based Slides
- #Market and Competitor Analysis
- #Graph
- #Market Status
- #Industry Trends
- #Horizontal Bar
- #Segmented Horizontal Bar
- #16:9
- #100% stacked bar chart
- #stacked horizontal bar graph PowerPoint
- #market trend presentation slide
- #data ratio comparison chart
- #year-over-year analysis PPT
About the Product
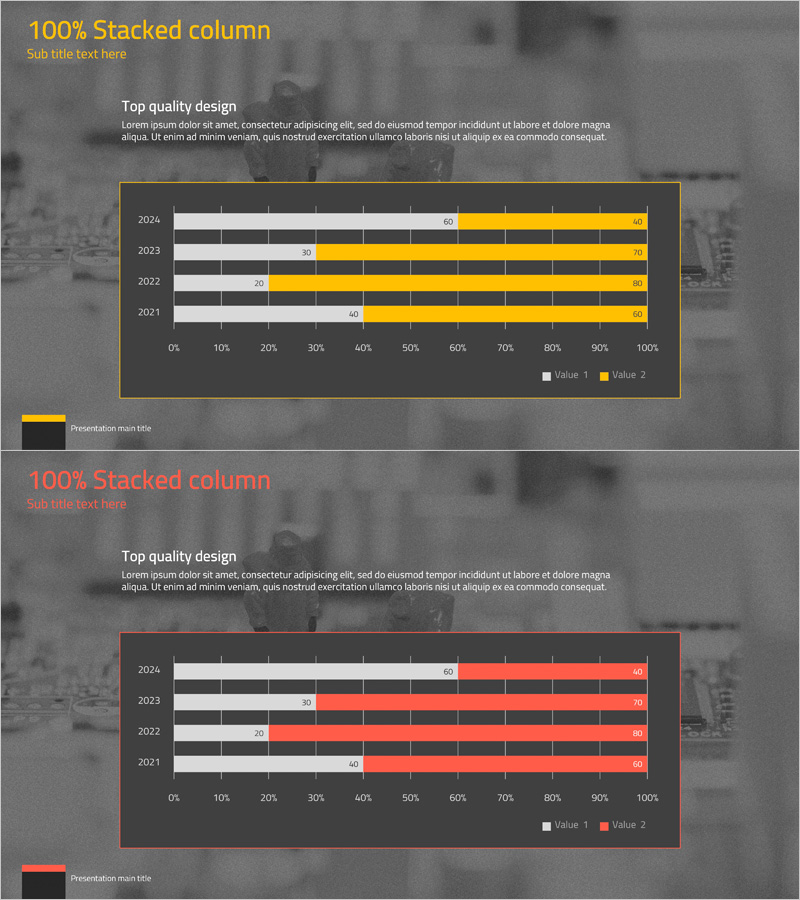
A 100% stacked horizontal bar chart PowerPoint slide designed to visualize technology service market trends and status. This presentation template displays four years of data (2021–2024) across two value series, clearly showing proportional changes over time. The dark background with gold and yellow accent colors ensures high readability, while the horizontal axis (0–100%) and year-by-year labels maximize information clarity. Ideal for business presentations on market share analysis, revenue composition, growth rate comparison, and competitive positioning in technology and service sectors.
Usage Points
-
Main Usage
Designed to compare technology service market data across multiple years using ratio-based analysis. The 100% stacked structure intuitively displays the relative proportion changes of each series against the total, making it ideal for presenting market share, revenue mix, customer segment distribution, and competitive positioning.
-
How to Use
Use this slide in market analysis reports, executive presentations, investor briefings, and quarterly business reviews. Simply replace the year labels and data values with your actual figures, and adjust the color scheme to match your corporate branding guidelines for immediate deployment.
-
Recommended For
Marketing professionals, executives, data analysts, management consultants, and business strategists presenting market insights. Particularly effective for technology, IT, financial services, telecommunications, and consulting industries explaining market dynamics and competitive trends.
-
Slide Structure
Two-slide template, each displaying a 100% stacked horizontal bar chart with four years of data (2021–2024) across two value series. Features a dark background with gold and yellow color differentiation, horizontal axis scaled 0–100%, year labels, and numeric data point indicators for precise information delivery.
Related Products
-

Plant Cultivation Awareness Graph – Visualizing Market Status with Horizontal Bar
#Market and Competitor Analysis #Graph #Market Status
-

Market Status and Trend Graph – Harmony of Blue and Orange
#Market and Competitor Analysis #Graph #Market Status
-

World Travel Template Horizontal Bar Segment Chart
#Market and Competitor Analysis #Graph #Industry Trends
-

Area Graph & Notebook Mockup for Market Trend Analysis
#Market and Competitor Analysis #Graph #Other
