Global Market Share and User Growth Statistics – Popularity of AI Tools
RJ0400074_5
- Last Update 06/07/2025
- File Size 1.9MB
- # of Slides 2
- File Format PPTX
- Slide Ratio 16:9
- Color
Keywords
- #Content-Based Slides
- #Design-Based Slides
- #Market and Competitor Analysis
- #Graph
- #Market Status
- #Market Share
- #Column
- #Circles
- #Column Chart
- #Pie Chart
- #16:9
- #pie chart PowerPoint slide
- #vertical bar graph presentation
- #market share chart template
- #user growth graph
- #statistical data visualization
- #ratio chart download
About the Product
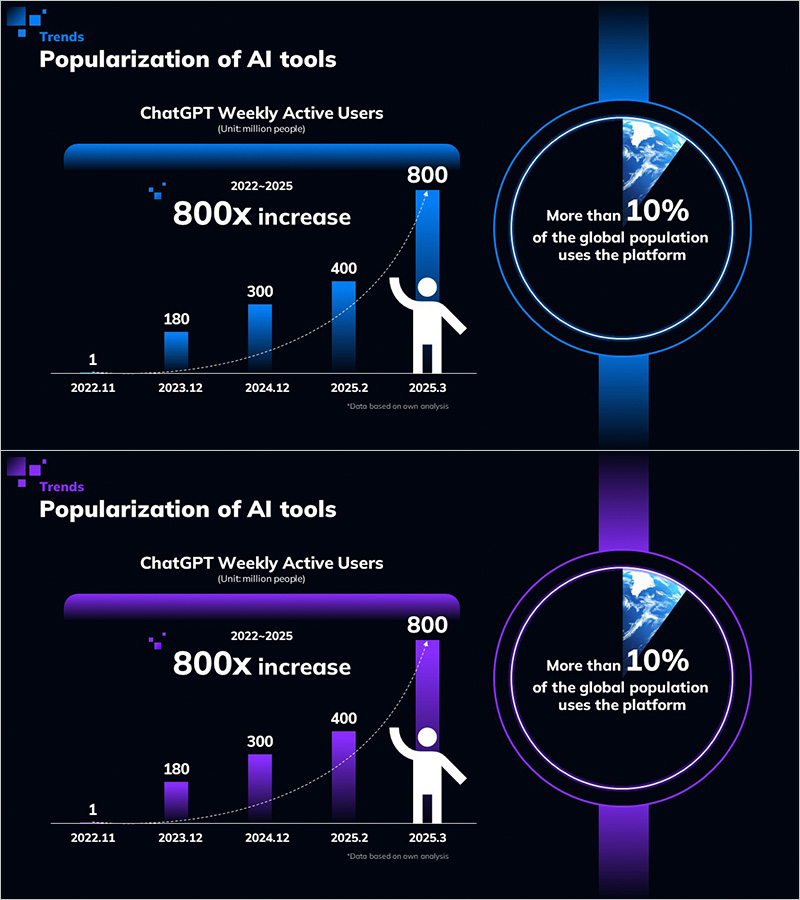
A 2-slide PowerPoint presentation set visualizing global market share and user growth trends of AI tools. The first slide displays a pie chart showing platform usage as a percentage of the global population, while the second slide presents a vertical bar graph tracking weekly active users from 2022 to 2025 with an 800x growth rate annotation. Dark background with blue or purple gradient bars and circular chart borders emphasize data impact. Instantly applicable to statistical reports, market analysis presentations, business performance reports, and investor pitch decks. Optimized for clearly communicating numerical data and proportions to audiences.
Usage Points
-
Main Usage
Clearly visualize global market share, user growth trends, and statistical data through pie and vertical bar charts to enhance audience comprehension and reinforce data credibility in business presentations.
-
How to Use
Input actual market share percentages into the first slide's pie chart and insert monthly or quarterly growth data into the second slide's bar graph. Colors and legends are fully editable to match corporate branding.
-
Recommended For
Marketing managers, business planning teams, investor relations specialists, data analysts, and executives presenting market conditions, user growth rates, and market share changes to stakeholders.
-
Slide Structure
Slide 1: One donut-style pie chart + two text areas (title and subtitle) / Slide 2: Vertical bar graph with 5 data points + one trend line + growth rate emphasis text area + legend. Full 16:9 aspect ratio, PPTX format.
Related Products
-

Agricultural Equipment Investment Plan Pie Chart
#Market and Competitor Analysis #Graph #Market Status
-

Pie Chart Slide Visualizing Transportation Status
#Market and Competitor Analysis #Graph #Market Status
-

City and Nature Pie Chart Statistics – Visualization of Market Status
#Market and Competitor Analysis #Graph #Market Status
-

Pie Chart Analysis for International Trade – Market Share Visualization
#Market and Competitor Analysis #Graph #Market Status
