Simple Circle Presentation Template Bilateral Bar Graph
RJ0200013_29
- Last Update 04/01/2025
- File Size 0.4MB
- # of Slides 2
- File Format PPTX
- Slide Ratio 16:9
- Color
Keywords
- #Content-Based Slides
- #Design-Based Slides
- #Market and Competitor Analysis
- #Graph
- #Competitive Advantage
- #Horizontal Bar
- #Double Horizontal Bar
- #16:9
- #bilateral bar chart PowerPoint
- #two-sided comparison slide
- #competitive analysis graph
- #market analysis PowerPoint template
- #dual-axis bar chart slide
About the Product
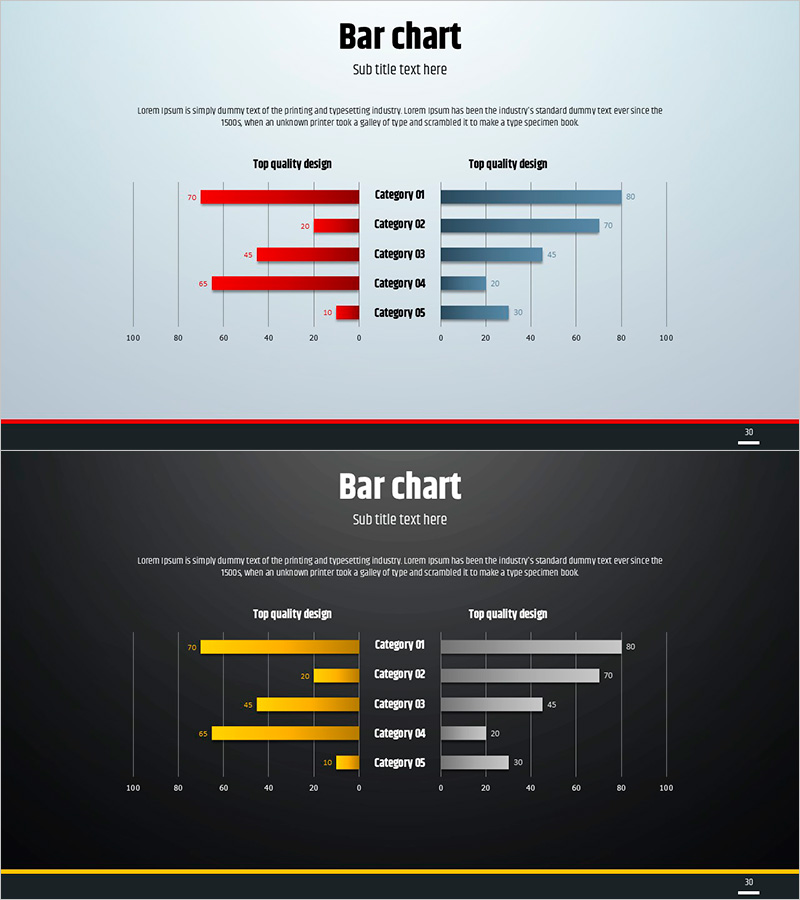
A bilateral bar chart PowerPoint slide with left-right symmetrical layout for direct data comparison. The dual-color design uses red and blue bars to represent two groups across five categories, making numerical differences immediately visible. Ideal for market analysis, competitive benchmarking, and performance comparisons in business presentations. The 16:9 widescreen format includes two fully editable slides where data values automatically update the bar lengths.
Usage Points
-
Main Usage
Presents two data groups in left-right symmetrical arrangement for intuitive side-by-side comparison. Red and blue color coding clearly distinguishes contrasting datasets, while five category bars enable quick numerical difference assessment.
-
How to Use
Apply to competitive performance benchmarking, market share comparison, year-over-year growth analysis, departmental target achievement tracking, and sales region performance reviews. Input numerical values to automatically adjust bar lengths for rapid slide updates.
-
Recommended For
Marketing strategy presentations, business performance reports, market research findings, executive briefings, investor pitch decks, and quarterly business reviews where comparative analysis between two entities is essential.
-
Slide Structure
Left side: five red bars (Category 01–05); right side: five blue bars mirroring the left. Numerical labels on each bar. Title and subtitle area at top; legend at bottom. Two-slide set enables multiple dataset presentations with consistent formatting.
Related Products
-

Business Competitor Analysis Graph
#Market and Competitor Analysis #Graph #Competitor Analysis
-

Competitor Analysis and Advantage Graph – Utilizing Blue, Orange, Green Colors
#Market and Competitor Analysis #Graph #Competitor Analysis
-

Two-way Bar Graph Showing Differences – Market Competition Analysis
#Market and Competitor Analysis #Graph #Competitive Advantage
-

Blue Red Two-way Graph – Highlighting Competitive Advantage
#Business Strategy #Market and Competitor Analysis #Graph
