Two-way Bar Graph Showing Differences – Market Competition Analysis
RJ0200012_25
- Last Update 03/31/2025
- File Size 1.3MB
- # of Slides 2
- File Format PPTX
- Slide Ratio 16:9
- Color
Keywords
- #Content-Based Slides
- #Design-Based Slides
- #Market and Competitor Analysis
- #Graph
- #Competitive Advantage
- #Horizontal Bar
- #Double Horizontal Bar
- #16:9
- #two-way bar chart PowerPoint
- #horizontal bar graph template
- #comparison analysis slide
- #market competition analysis PPT
- #how to create bar chart in PowerPoint
About the Product
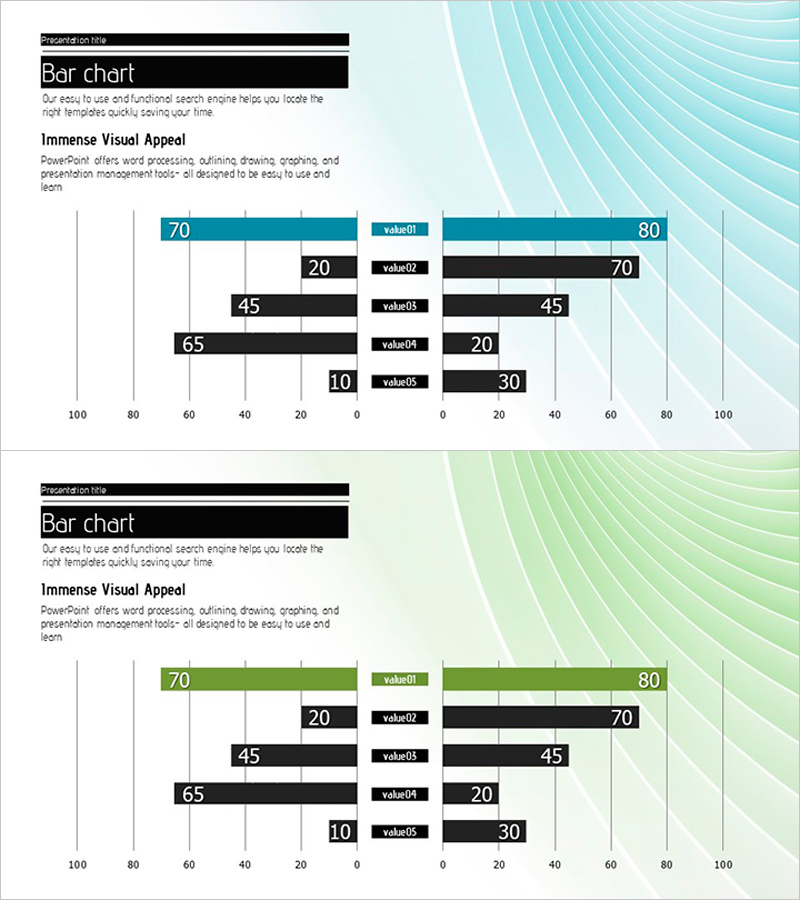
A two-way horizontal bar chart PowerPoint slide optimized for market competition analysis and comparative data visualization. Data points are positioned on opposite sides of a central axis, with left and right values clearly contrasting to show differences between two groups. Five items can each display opposing values (left 10–70, right 20–80), with teal and black color coding for instant visual distinction. The wave-pattern background adds visual depth to presentations, while horizontal gridlines aid numerical readability. Ideal for competitive analysis, market share comparison, strengths-vs-weaknesses assessment, and other business presentations requiring side-by-side data contrast.
Usage Points
-
Main Usage
Visualize contrasting data between two groups at a glance. Ideal for competitor strength-weakness analysis, market share comparison, A/B performance contrast, regional or departmental results comparison, and any presentation requiring opposing data representation.
-
How to Use
Enter first group values on the left side of the central axis and second group values on the right. Replace item labels (value01–value05) with your category names and edit numerical values; bar lengths adjust automatically. Colors can be modified via the theme color palette.
-
Recommended For
Marketing professionals presenting competitive analysis, sales teams reporting market conditions, strategy planners analyzing positioning, finance teams comparing departmental performance, consultants preparing benchmarking analysis materials.
-
Slide Structure
Two-slide set. Slide 1: Teal-accent version (first left item 70 highlighted). Slide 2: Green-accent version (first left item 70 highlighted). Each slide contains five two-way bars, central axis, 0–100 horizontal scale, and item labels. 16:9 widescreen format.
Related Products
-

Competitor Product Analysis and Competitive Advantage Bar Chart – Market Share Comparison
#Market and Competitor Analysis #Graph #Competitor Analysis
-

Competitor Analysis and Advantage Chart – The Harmony of Blue and Red
#Market and Competitor Analysis #Graph #Competitor Analysis
-

Sales Comparison Graph by Product – Competitive Advantage and Performance Analysis
#Market and Competitor Analysis #Financial Plans and Performance #Graph
-

Blue Red Two-way Graph – Highlighting Competitive Advantage
#Business Strategy #Market and Competitor Analysis #Graph
