Competitor Analysis and Advantage Graph – Utilizing Blue, Orange, Green Colors
RJ0400017_28
- Last Update 05/22/2025
- File Size 0.2MB
- # of Slides 2
- File Format PPTX
- Slide Ratio 16:9
- Color
Keywords
- #Content-Based Slides
- #Design-Based Slides
- #Market and Competitor Analysis
- #Graph
- #Competitor Analysis
- #Competitive Advantage
- #Horizontal Bar
- #Double Horizontal Bar
- #16:9
- #diverging bar chart PowerPoint
- #competitor analysis slide template
- #horizontal bar comparison
- #symmetric chart PPT
- #competitive advantage presentation
- #how to create diverging chart in PowerPoint
About the Product
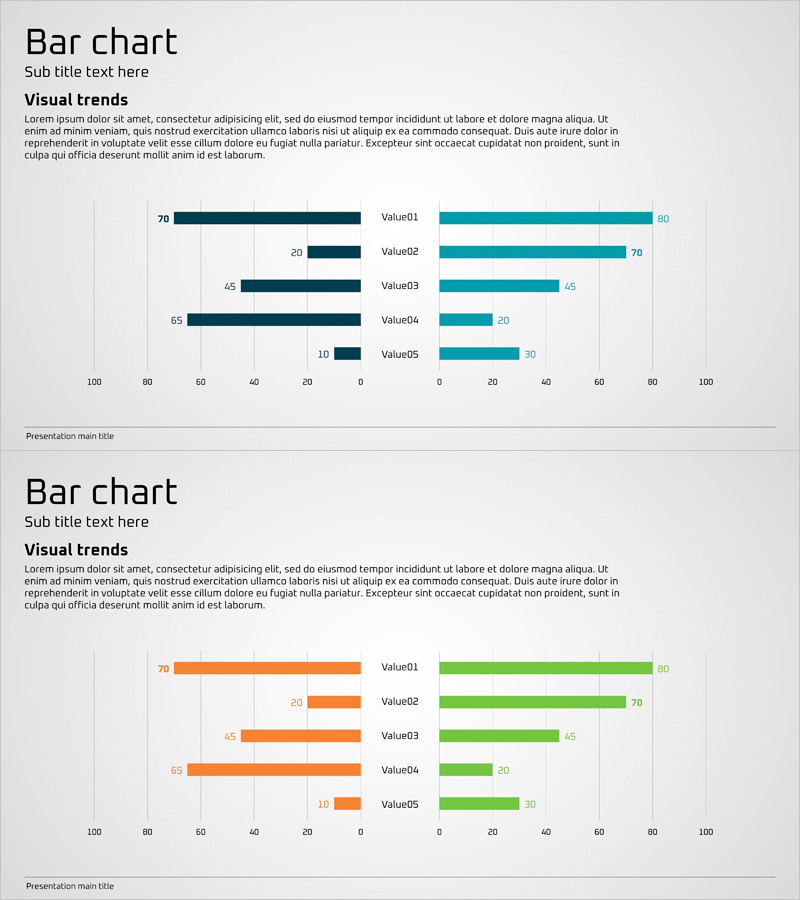
A diverging bar chart PowerPoint slide designed for competitor analysis and advantage comparison. This presentation template uses dark blue, orange, and green colors to highlight contrasting data at a glance. The symmetric layout features 5 items (Value01 through Value05) positioned on opposite sides of a central axis, making it ideal for competitive positioning, market analysis, and performance benchmarking. The 2-slide deck offers two color combinations to suit different presentation contexts, formatted in 16:9 widescreen PPTX for seamless integration into your business presentations.
Usage Points
-
Main Usage
Visualize contrasting metrics and comparative analysis through symmetric bar positioning. Ideal for competitive positioning, market differentiation, performance benchmarking, and strategic decision-making presentations where two opposing viewpoints or metrics need clear visual comparison.
-
How to Use
Edit the title and subtitle fields to reflect your analysis topic. Update the numerical values for each of the 5 items to match your data. Choose between the two color schemes (dark blue with orange or dark blue with green) based on your presentation theme and audience context.
-
Recommended For
Strategy teams, marketing departments, executives, management consultants, and business development professionals presenting competitive analysis, market positioning, performance comparisons, or strategic alternatives. Effective for board meetings, investor presentations, and strategic planning sessions.
-
Slide Structure
2-slide layout with symmetric diverging bar design. Each slide displays 5 data items positioned on opposite sides of a central zero axis. Slide 1 uses dark blue and orange color scheme; Slide 2 uses dark blue and green. Both maintain identical structural layout for consistent data representation.
Related Products
-

Business Forest Wide Template Bilateral Bar Graph
#Market and Competitor Analysis #Graph #Competitor Analysis
-

Camping Isometric Target Market Strategy Horizontal Bar Chart
#Market and Competitor Analysis #Graph #Competitor Analysis
-

Halloween Witch and Two-way Graph
#Market and Competitor Analysis #Graph #Competitor Analysis
-

Competitor Analysis and Competitive Advantage – Red, Blue, Purple Bar Chart
#Market and Competitor Analysis #Graph #Competitor Analysis
