Blue Red Two-way Graph – Highlighting Competitive Advantage
RJ0600056_8
- Last Update 07/05/2025
- File Size 2.2MB
- # of Slides 2
- File Format PPTX
- Slide Ratio 16:9
- Color
Keywords
- #Content-Based Slides
- #Design-Based Slides
- #Business Strategy
- #Market and Competitor Analysis
- #Graph
- #Achievements
- #Competitive Advantage
- #Horizontal Bar
- #Double Horizontal Bar
- #16:9
- #two-way horizontal bar chart PowerPoint
- #dual-sided bar graph presentation
- #competitive analysis slide
- #market comparison chart
- #how to create comparison chart in PowerPoint
About the Product
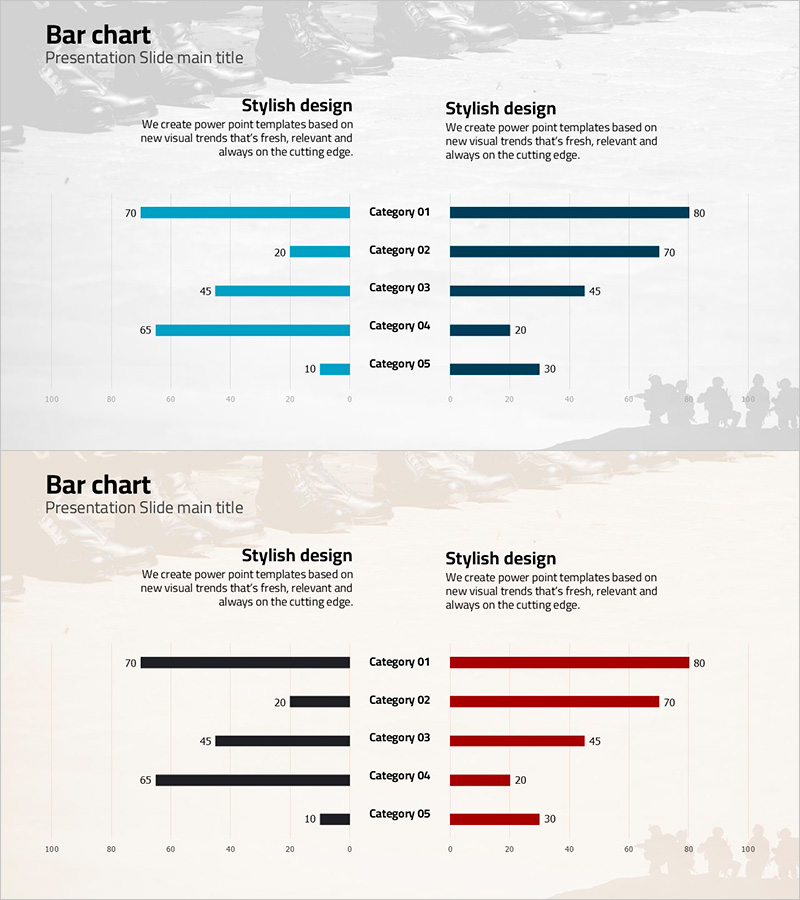
A two-way horizontal bar chart PowerPoint slide designed for competitive advantage analysis and market comparison. The slide visualizes five categories of data with blue bars on the left and red bars on the right, creating a clear contrast ideal for competitor analysis, strengths and weaknesses comparison, and market positioning. The 16:9 widescreen format includes 2 slides ready for immediate editing and can be used in presentations, reports, and strategic planning documents.
Usage Points
-
Main Usage
Clearly express comparative analysis data such as competitor benchmarking, strengths versus weaknesses, and market positioning using a left-right symmetrical structure. The blue and red color contrast intuitively communicates differences between two groups, and numerical comparisons strengthen decision-making rationale.
-
How to Use
Edit the left blue bars and right red bars with your data to compare company vs. competitors, option A vs. option B, current vs. target, or any dual-sided metrics. Simply update category names and values to apply the slide to investor presentations, strategy meetings, and market analysis reports.
-
Recommended For
Strategy planning teams, marketing departments, sales teams, and executives preparing reports. Recommended for presentations and reports requiring competitor analysis, market entry strategy, product positioning, and performance comparison analysis.
-
Slide Structure
2-slide set. Each slide features a two-way horizontal bar chart with 5 categories arranged symmetrically. Left side displays blue-toned bars (0–100 scale), right side displays red-toned bars (0–100 scale), with category labels and numerical values clearly marked for easy customization.
Related Products
-

Ice Hockey Competition Chart – Performance Analysis and Strategy
#Business Strategy #Market and Competitor Analysis #Graph
-

Highlighting Competitive Advantage with Comparative Bifurcated Bar Chart
#Market and Competitor Analysis #Graph #Competitive Advantage
-

Competitor Comparison Analysis Graph
#Market and Competitor Analysis #Graph #Competitor Analysis
-

Car Wide Template Bilateral Bar Graph
#Market and Competitor Analysis #Graph #Competitor Analysis
