Simple Circle Presentation Template Diagram – Visualizing Flow and Cycle
RJ0200013_23
- Last Update 04/01/2025
- File Size 1.1MB
- # of Slides 2
- File Format PPTX
- Slide Ratio 16:9
- Color
Keywords
- #Content-Based Slides
- #Design-Based Slides
- #Technical Approach
- #Diagram
- #Service Operation Plan
- #Research and Development
- #Flow
- #Circular Flow
- #16:9
- #circular diagram PowerPoint
- #3-stage flow diagram
- #cyclical process slide template
- #bidirectional arrow diagram
- #business process visualization PowerPoint
About the Product
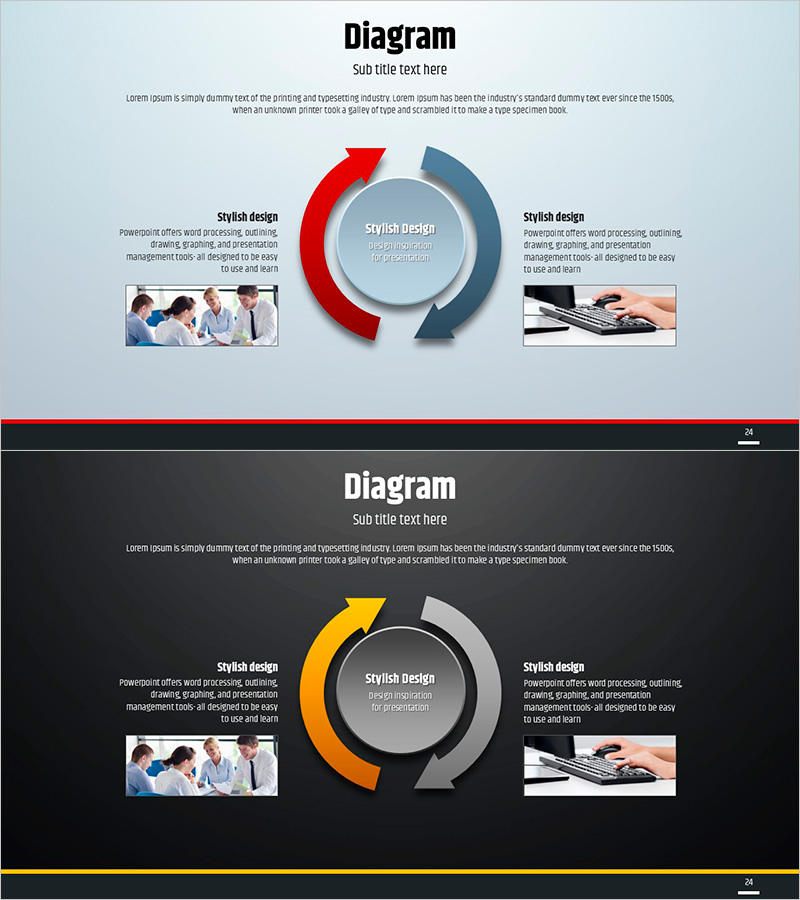
A 3-stage circular diagram PowerPoint slide designed to visualize business processes and cyclical structures. Red and blue arrows flow bidirectionally from a central circular hub, making it ideal for expressing service operation cycles, technology development processes, and research workflows. The light blue background contrasts with dark-toned arrows to enhance information clarity, while left and right image areas allow you to add stage-specific supporting materials. The 2-slide set includes both light and dark background versions, enabling you to adapt to different presentation environments. Perfect for illustrating repetitive and interconnected workflows in corporate presentations.
Usage Points
-
Main Usage
Clearly express repetitive and cyclical structures such as business processes, service operation cycles, technology development flows, and research stages in three distinct stages. The central circular hub emphasizes the core concept, while bidirectional arrows highlight the interconnected relationships between stages, enhancing audience comprehension.
-
How to Use
Enter stage-specific titles and descriptions in each arrow section, then insert relevant photos, charts, or icons in the left and right image areas. Add your core message to the central circular text box for immediate presentation use. The light background version suits bright conference rooms, while the dark version works well in dimly lit auditoriums.
-
Recommended For
Recommended for process explanation presentations by technology teams, R&D departments, operations teams, and marketing teams. Effective in business plans, technical proposals, operational reports, and educational seminar materials when explaining cyclical structures. Particularly useful for visualizing service improvement cycles, product development stages, and quality management processes.
-
Slide Structure
2-slide set. Each slide features a central circular hub (text input area) + 3 bidirectional arrows (red and blue tones) + left and right image insertion areas. The first slide has a light blue background, while the second features a dark gray background, allowing you to select based on your presentation environment.
Related Products
-

Business Risk Management – Visualization of Flow and Circulation
#Operational Plan #Technical Approach #Diagram
-

Animal Nature Conservation Program Service Operation Plan Circulation Diagram
#Product/Service Introduction #Technical Approach #Diagram
-

Operating Method Characteristics Circular Diagram
#Product/Service Introduction #Technical Approach #Diagram
-

Cognitive Process Diagram – Cluster-Based Operational Plan
#Operational Plan #Technical Approach #Diagram
