Business Risk Management – Visualization of Flow and Circulation
RJ0800030_24
- Last Update 08/08/2025
- File Size 3.6MB
- # of Slides 2
- File Format PPTX
- Slide Ratio 16:9
- Color
Keywords
About the Product
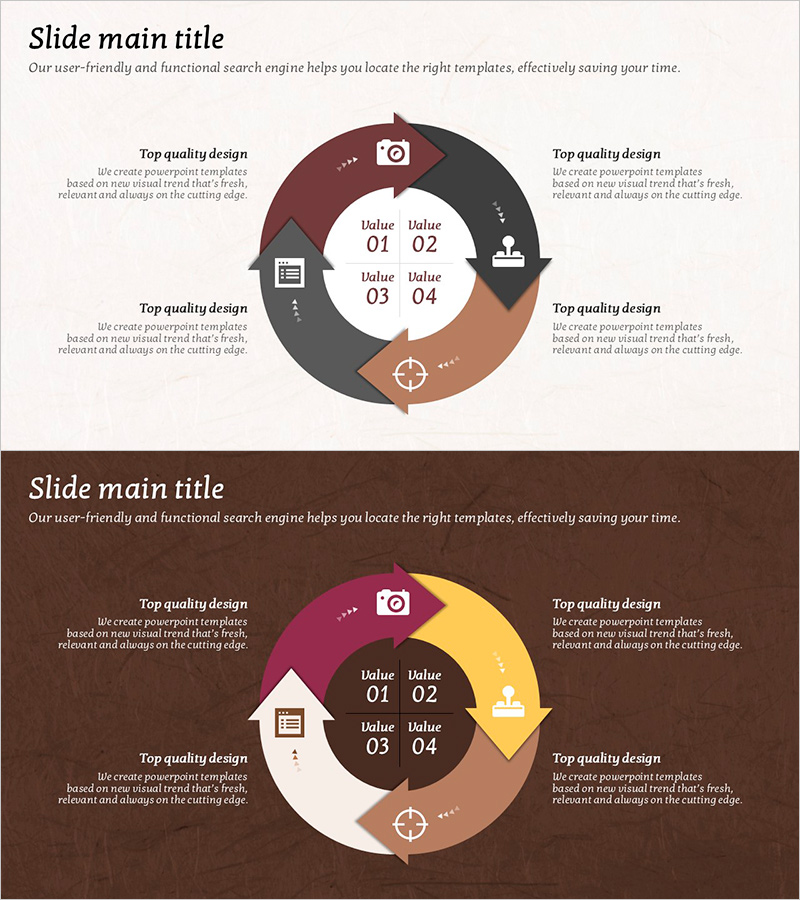
A 4-stage circular diagram PowerPoint slide designed to visualize business risk management and process flow. The harmonious color palette of brown, gray, and khaki creates a trustworthy atmosphere, while icons (camera, document, person, target) at each stage enhance information clarity. Two layout options—light background and dark background—allow you to match your presentation's tone. The central value input area with four data fields enables easy customization, and directional arrows clearly show the circular flow. Instantly applicable for risk management, process improvement, cycle management, and other business contexts in presentations.
Usage Points
-
Main Usage
Optimized for breaking down business risk management, process improvement cycles, quality management circular structures, and organizational operation flows into 4 stages with visual clarity. The central value input area allows you to express key metrics or descriptions for each stage precisely.
-
How to Use
Use in the strategy, operations, or management sections of presentations to explain cyclical processes or repetitive structures. Customize stage icons to match your organization's context, input specific figures or descriptions in the central value area, and select either light or dark background layout to align with your presentation tone.
-
Recommended For
Ideal for executives, risk managers, process improvement specialists, quality management teams, and organizational development professionals presenting in executive reports, strategy meetings, training seminars, and consulting proposals where circular structures need explanation.
-
Slide Structure
Four-section circular structure (clockwise) with icons, text areas, and value input fields (Value 01–04) at each section. Central value input area with four data fields and directional arrows indicating circular flow. Composed of two color background layouts: light tone and dark tone.
Related Products
-

Travel Guide Business Risk Management Cycle Diagram
#Operational Plan #Technical Approach #Diagram
-

Animal Care Circulation Diagram
#Operational Plan #Technical Approach #Diagram
-

Tri-Point Analysis in 3D Frames – Operational Planning and Risk Management
#Operational Plan #Technical Approach #Diagram
-

Business Forest Wide Template Diagram12 – Operational and Technical Strategy
#Operational Plan #Technical Approach #Diagram
