Origami Concept Table – Visualizing Financial Performance
RB0800007_17
- Last Update 03/18/2025
- File Size 0.2MB
- # of Slides 2
- File Format PPTX
- Slide Ratio 4:3
- Color
Keywords
About the Product
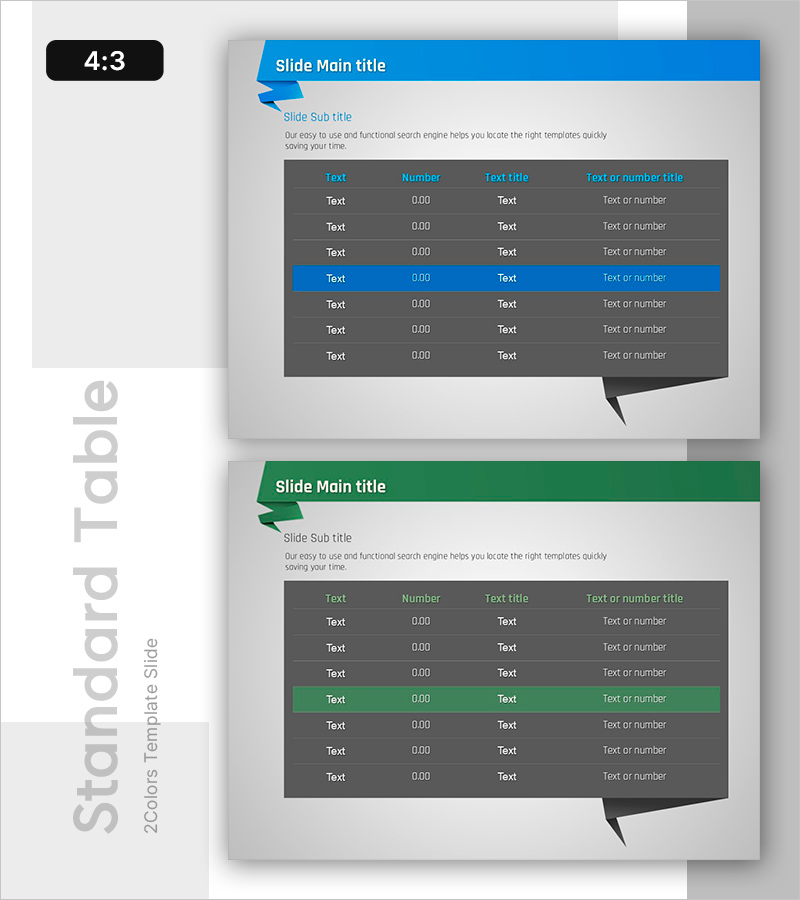
A 4-column by 7-row table PowerPoint slide designed for presenting financial performance, numerical comparisons, and data-driven insights. Blue and green highlight rows visually distinguish key information, creating strong contrast against the gray data cells for improved readability. Two color theme options (blue and green) allow you to match your presentation's tone and branding. Clear separation of number, text, and title columns makes this slide template ideal for financial reports, performance analysis, balance sheets, and data-focused presentations that require structured information layout.
Usage Points
-
Main Usage
Present financial results, sales figures, cost analysis, and other numerical data in a clear, structured table format. Blue and green highlight rows draw attention to key metrics and critical information, enhancing audience engagement and data comprehension.
-
How to Use
Insert your financial data, quarterly results, departmental budgets, or competitive analysis into the table cells. Customize row colors to emphasize different data points. Use the two color theme options to align with your presentation's visual identity and corporate branding.
-
Recommended For
CFOs, financial analysts, and executives presenting financial reports; investor relations presentations; business performance reviews; marketing teams analyzing campaign ROI; operations teams sharing KPI dashboards and quarterly performance metrics.
-
Slide Structure
4-column × 7-row table structure. Header row features blue background with light text. Data rows use gray background. Highlight rows (4th and 5th) are colored blue and green respectively. Two slides provided with identical structure in two distinct color themes for flexibility.
Related Products
-

Green Brown Statistics Table – Financial Performance Analysis
#Financial Plans and Performance #Diagram #Balance Sheet
-

Simple Yellow Purple Table – Financial Performance Visualization
#Financial Plans and Performance #Diagram #Balance Sheet
-

Visualizing Financial Performance with Standard Table Slide
#Financial Plans and Performance #Diagram #Balance Sheet
-

Analysis Table of Korean Culture – An Effective Data Visualization Tool
#Financial Plans and Performance #Diagram #Balance Sheet
