Blue Green Yearly Bundle Horizontal Bar Chart
RJ0200012_18
- Last Update 03/31/2025
- File Size 1.3MB
- # of Slides 2
- File Format PPTX
- Slide Ratio 16:9
- Color
Keywords
- #Content-Based Slides
- #Design-Based Slides
- #Market and Competitor Analysis
- #Graph
- #Industry Trends
- #Horizontal Bar
- #Grouped Horizontal Bar
- #16:9
- #grouped horizontal bar chart
- #year-over-year data comparison PowerPoint
- #4-series bar chart slide
- #market analysis presentation
- #data visualization template download
About the Product
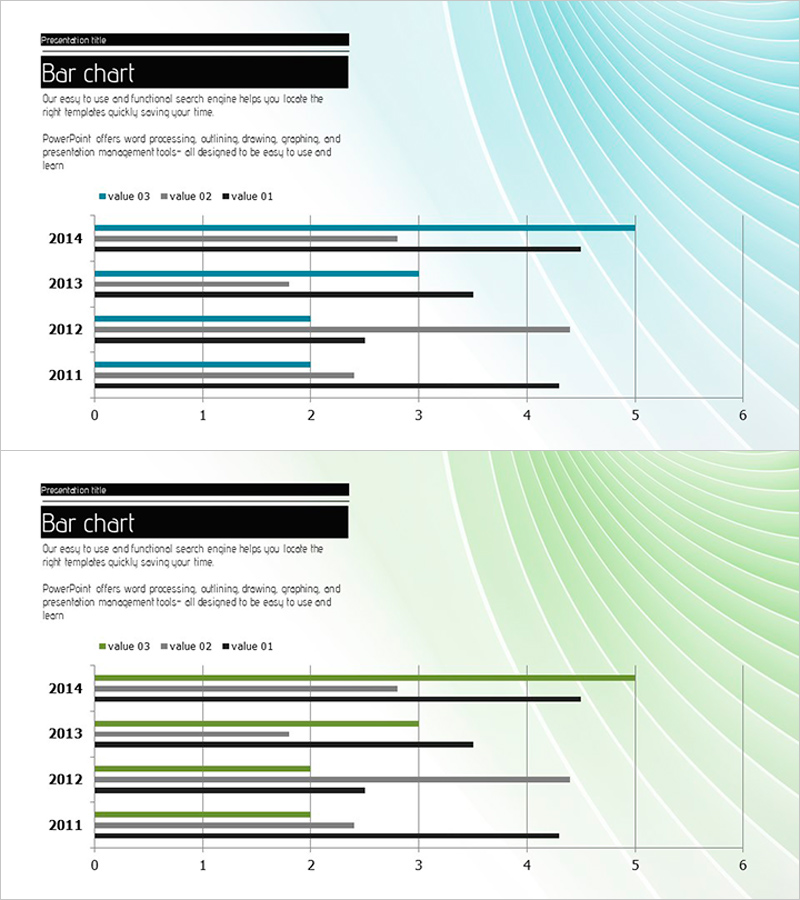
A grouped horizontal bar chart PowerPoint slide designed to compare year-over-year data across four series from 2014 to 2011. The slide uses blue, green, and black color schemes to distinguish each data series, with a numerical axis ranging from 0 to 6 for clear value representation. This presentation template is ideal for business reports, market analysis, and performance reviews. The 16:9 widescreen format includes 2 slides ready for immediate editing and customization to match your data and branding.
Usage Points
-
Main Usage
This slide enables side-by-side comparison of multiple data series across different time periods. Perfect for visualizing sales trends, market metrics, performance indicators, or competitive benchmarks across four categories simultaneously, making data patterns and year-to-year changes immediately apparent.
-
How to Use
Insert this slide into business reports, quarterly performance presentations, or market analysis decks. Replace the sample data by editing each bar length to match your actual figures, update the legend labels to reflect your data categories, and adjust colors and fonts to align with your corporate branding guidelines.
-
Recommended For
Ideal for executives, marketing teams, sales departments, and data analysts presenting quarterly reports, annual reviews, market research findings, and competitive analysis. Suitable for financial summaries, customer metrics comparison, and strategic planning presentations.
-
Slide Structure
The 2-slide set features identical grouped horizontal bar chart layouts. Each slide displays 4 data series (value 03, 02, 01, and black series) arranged across 4 year rows (2011–2014). Includes a numerical axis (0–6 range) and color-coded legend for complete chart functionality.
Related Products
-

Bundled Horizontal Bar Graph for Market Trend Analysis – A New Perspective on Data
#Market and Competitor Analysis #Graph #Market Status
-

Green Red Year Bundled Graph
#Business Strategy #Market and Competitor Analysis #Graph
-

Market Analysis and Trend Graph – Using Blue, Orange, and Green
#Market and Competitor Analysis #Graph #Market Analysis
-

Data Visualization with Bar Chart – Stylish Design
#Product/Service Introduction #Market and Competitor Analysis #Graph
