Triple Blue Green Donut Chart – Visual Data Analysis
RJ0200012_10
- Last Update 03/31/2025
- File Size 1.9MB
- # of Slides 2
- File Format PPTX
- Slide Ratio 16:9
- Color
Keywords
About the Product
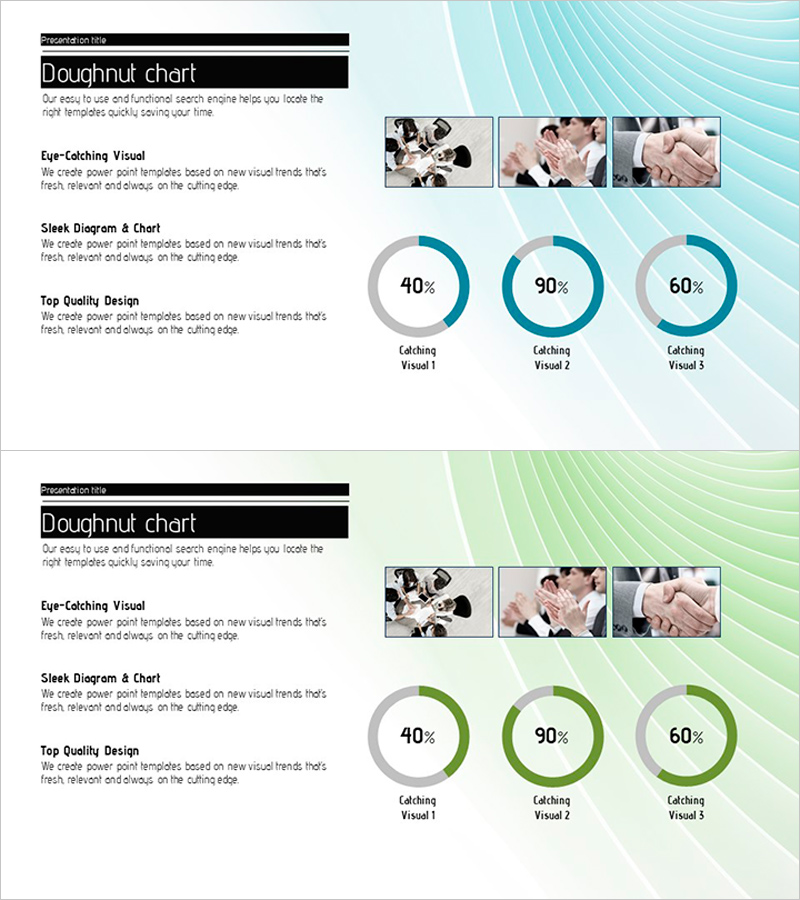
A PowerPoint slide featuring three concentric donut charts for visualizing multi-layered data. The design uses blue, green, and gray gradient tones to distinguish each data series, with percentage labels positioned at the center for intuitive ratio comparison. Ideal for market analysis, customer segmentation, and revenue composition presentations. This ready-to-edit template comes in 2 slides optimized for 16:9 widescreen format, making it perfect for business reports, marketing plans, and investor presentations.
Usage Points
-
Main Usage
Simultaneously display multiple ratio data such as market share, customer segmentation, revenue composition, and brand awareness across three concentric layers. The centered percentage labels emphasize precise values while the concentric structure clarifies relationships between hierarchical levels.
-
How to Use
Use in business reports, marketing plans, and investor presentations to compress complex multi-series data into a single slide. Simply edit the donut ring colors and percentages with your actual data, then the slide is ready for immediate presentation use.
-
Recommended For
Marketing managers, executives, data analysts, and sales leaders presenting quarterly performance reports, market analysis, and customer segmentation. Particularly effective for executive briefings and strategic planning meetings requiring multi-metric comparisons.
-
Slide Structure
Three concentric donut charts centered on the slide, each distinguished by blue, green, and gray gradient tones. Each series displays percentage labels (40%, 90%, 60%) at the center, with legend text 'Catching Visual 1, 2, 3' positioned on the right. The 2-slide template allows flexible data combinations and customization.
Related Products
-

Donut Chart of the Share of Real Estate Ownership – For Market Analysis
#Market and Competitor Analysis #Graph #Market Status
-

Stylish Design Business Presentation Template
#Market and Competitor Analysis #Graph #Market Status
-

User Analysis by Age Donut Circle Graph
#Market and Competitor Analysis #Graph #Market Status
-

Graph of User Status Analysis by Age Group
#Market and Competitor Analysis #Diagram #Graph
