Donut Chart of the Share of Real Estate Ownership – For Market Analysis
RJ0900026_7
- Last Update 08/24/2025
- File Size 0.5MB
- # of Slides 2
- File Format PPTX
- Slide Ratio 16:9
- Color
Keywords
About the Product
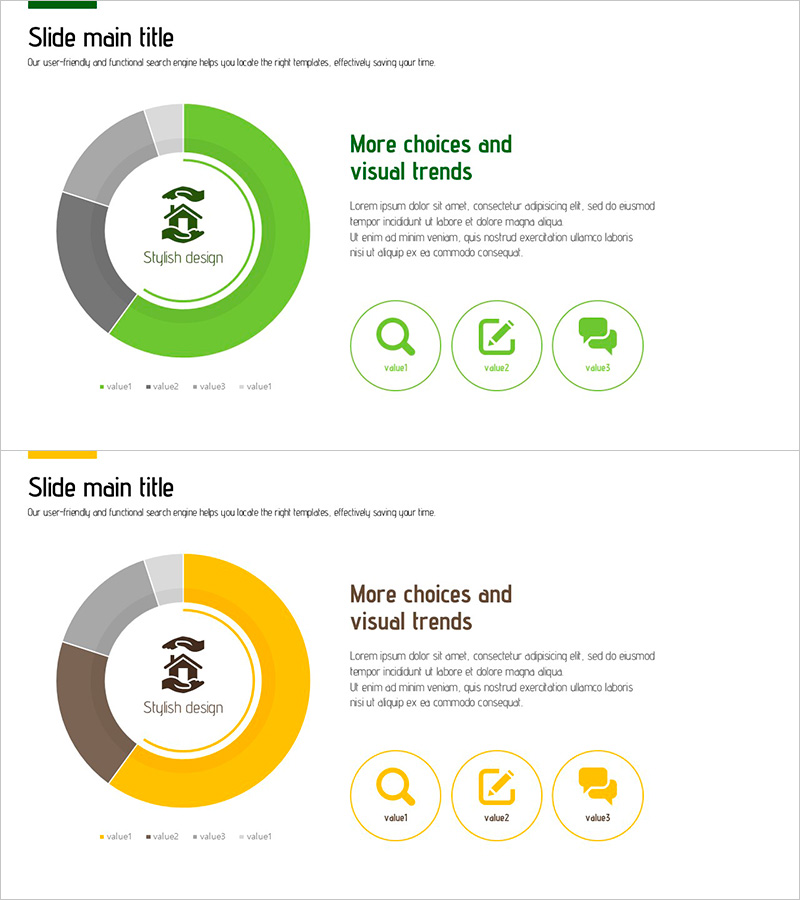
A professional donut chart PowerPoint slide designed for real estate market analysis and customer segmentation presentations. Available in two color versions—green and yellow—this template features a 4-segment donut structure with a central circular area for icons and key messaging. Each segment displays proportional data with clear legends, while three circular icon buttons on the right side provide space for supplementary information. The slide layout is optimized for comparing market share, property ownership distribution, customer demographics, and other ratio-based data in business reports and investment pitches.
Usage Points
-
Main Usage
Visualize proportional data such as real estate market share, customer distribution, market penetration rates, and asset allocation. The central circular area draws attention to key messages or brand icons, while the four segments allow simultaneous comparison of up to four categories. Ideal for presenting market analysis, competitive positioning, and demographic breakdowns.
-
How to Use
Replace the placeholder data and legends with your own figures. Select either the green or yellow color version based on your presentation theme and corporate branding. Customize the central icon and text area with your key message, and use the three circular icon buttons on the right to highlight supporting points or additional metrics.
-
Recommended For
Real estate professionals, financial analysts, marketing strategists, and business development teams presenting market analysis reports, investment proposals, and business pitches. Particularly effective when comparing four or more categories by percentage, such as market segments, customer types, property classifications, or revenue distribution.
-
Slide Structure
Two-slide template featuring a 4-segment donut chart as the focal point. The left side contains the donut diagram with a customizable central circle for icons and text. The right side displays three circular icon buttons for additional information. A legend and data entry area are positioned at the bottom. Formatted in 16:9 widescreen ratio for modern presentation environments.
Related Products
-

Triple Blue Green Donut Chart – Visual Data Analysis
#Market and Competitor Analysis #Graph #Market Status
-

User Analysis by Age Donut Circle Graph
#Market and Competitor Analysis #Graph #Market Status
-

Stylish Design Business Presentation Template
#Market and Competitor Analysis #Graph #Market Status
-

Graph of User Status Analysis by Age Group
#Market and Competitor Analysis #Diagram #Graph
