User Analysis by Age Donut Circle Graph
RM0100018_13
- Last Update 01/30/2025
- File Size 1MB
- # of Slides 2
- File Format PPTX
- Slide Ratio 16:9
- Color
Keywords
About the Product
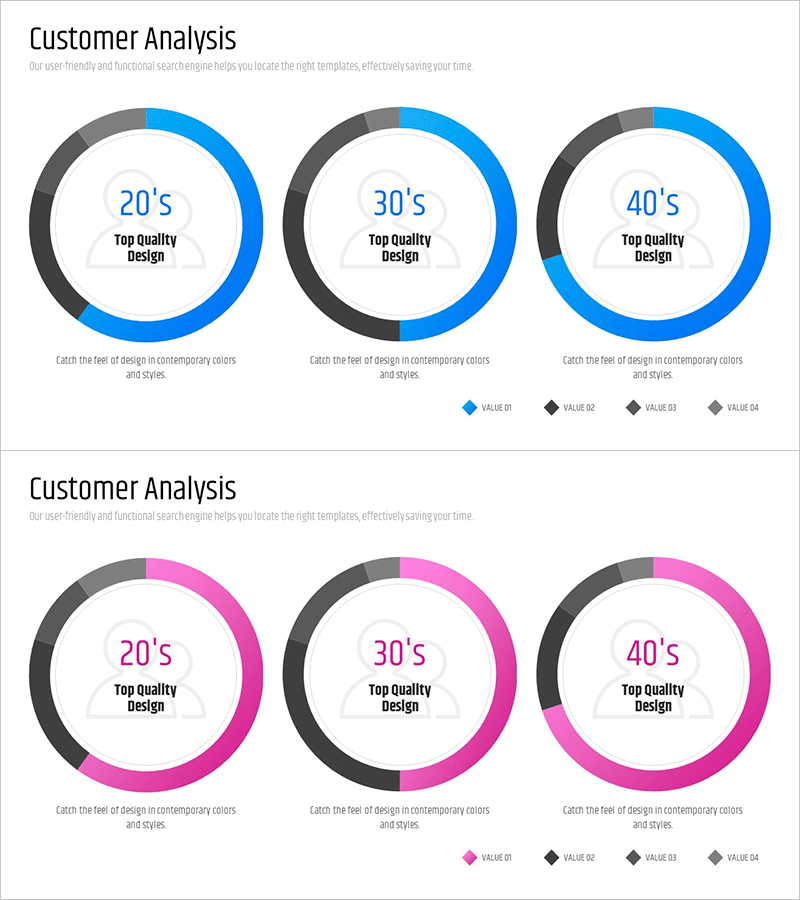
A donut circle graph PowerPoint slide designed for age-based customer analysis. This presentation template visualizes user composition across three age groups (20s, 30s, 40s) using four data values per segment. The first slide features a blue and charcoal color scheme, while the second slide presents a pink and charcoal variation, both with centered age labels and surrounding ratio segments. Ideal for customer analysis, market overview, and user statistics presentations, this 16:9 widescreen PPTX file is fully editable, allowing you to customize colors, data values, and text to match your specific reporting needs.
Usage Points
-
Main Usage
Visualize age-group customer distribution, user demographics, and market segmentation data through donut circle graphs to communicate ratio information intuitively in marketing strategy presentations, customer analysis reports, and business performance briefings.
-
How to Use
Double-click the donut chart segments on each slide to edit colors and percentage values. Modify age group labels and legend text to reflect your data, and duplicate slides as needed to represent additional analysis categories or time periods.
-
Recommended For
Marketing managers, market research analysts, sales planning teams, executives preparing performance reports, business strategists developing customer segmentation strategies, and organizations requiring data-driven presentations for stakeholder communication.
-
Slide Structure
Two-slide layout. Each slide displays three donut circle graphs (20s, 30s, 40s age groups) arranged horizontally, with each donut divided into four data segments (VALUE 01–04). The first slide uses blue and charcoal tones; the second employs pink and charcoal variations, providing flexible color options for diverse presentation contexts.
Related Products
-

Triple Blue Green Donut Chart – Visual Data Analysis
#Market and Competitor Analysis #Graph #Market Status
-

Stylish Design Business Presentation Template
#Market and Competitor Analysis #Graph #Market Status
-

Graph of User Status Analysis by Age Group
#Market and Competitor Analysis #Diagram #Graph
-

Donut Chart of the Share of Real Estate Ownership – For Market Analysis
#Market and Competitor Analysis #Graph #Market Status
