Rhombus Presentation Template Table Chart – Optimized for Financial Planning and Performance
RJ0200011_19
- Last Update 03/31/2025
- File Size 0.4MB
- # of Slides 2
- File Format PPTX
- Slide Ratio 16:9
- Color
Keywords
About the Product
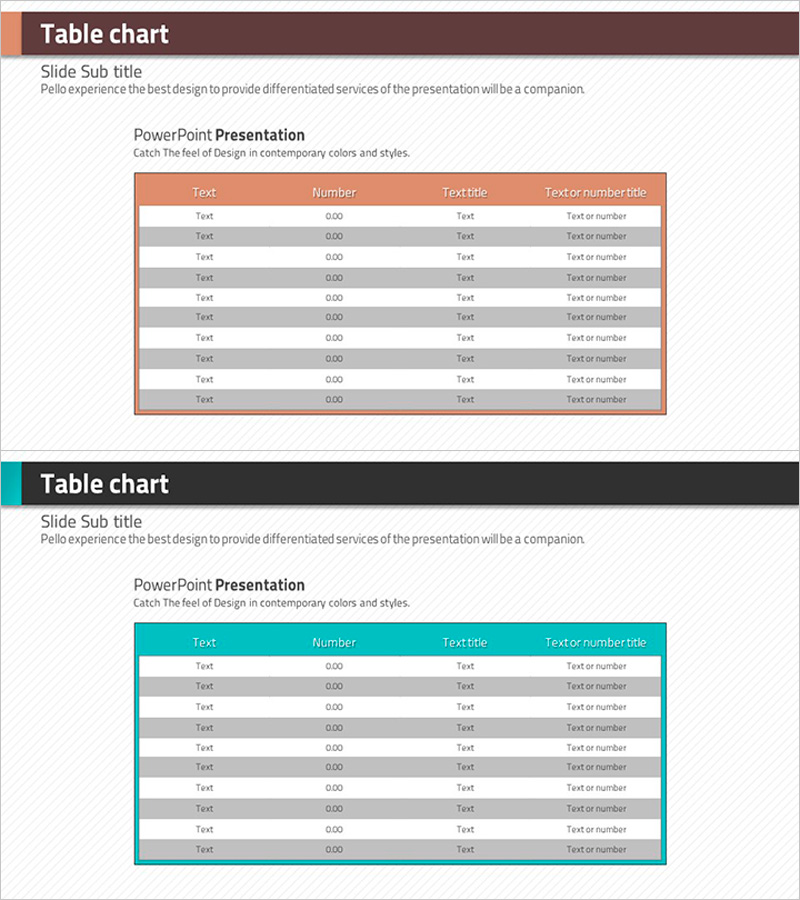
A 2-slide table chart PowerPoint presentation designed for financial planning and performance analysis. Features a 9-row by 4-column structure with orange header and alternating gray rows for clear data organization. The 16:9 widescreen PPTX format allows immediate editing and customization. Perfect for presenting financial data, performance metrics, cost breakdowns, sales figures, and business statistics. Each cell is fully editable to accommodate numbers, text, and titles, making it ideal for data-driven business presentations and reports.
Usage Points
-
Main Usage
Present numerical data such as financial planning, performance analysis, cost tracking, and sales results in a clear, organized table format. The 9-row structure provides ample space for data entries, while the orange header emphasizes column titles and gray alternating rows enhance readability.
-
How to Use
Enter text and numerical values into each cell to display financial data, performance indicators, cost items, or sales figures. Modify header row labels and input specific data into rows, then adjust colors and fonts as needed before inserting into your presentation.
-
Recommended For
Finance teams, executives, sales departments, and planning teams presenting quarterly performance reports, budget status, sales results, and cost analysis. Suitable for business plans, performance reports, investor pitch decks, and marketing strategy presentations.
-
Slide Structure
2-slide set with 9-row by 4-column table layout. Each slide features an orange header row (Text, Number, TextTitle, Text or number title) and alternating gray and white data rows. 16:9 aspect ratio PPTX format with fully editable cells.
Related Products
-

Standard Table Slide Design – Effective Data Comparison
#Financial Plans and Performance #Diagram #Budget
-

Graph of Operating Cost Reduction Strategies
#Financial Plans and Performance #Diagram #Graph
-

Eucalyptus Table Presentation Slide
#Financial Plans and Performance #Diagram #Budget
-

Love and Data Charts – Visualizing Financial Performance
#Financial Plans and Performance #Diagram #Budget
