Eucalyptus Table Presentation Slide
RJ0600110_16
- Last Update 07/21/2025
- File Size 4.4MB
- # of Slides 2
- File Format PPTX
- Slide Ratio 16:9
- Color
Keywords
- #Content-Based Slides
- #Design-Based Slides
- #Financial Plans and Performance
- #Diagram
- #Budget
- #Sales and Revenue
- #Table
- #Standard Table
- #16:9
- #data table PowerPoint slide
- #3-column table template
- #financial data table
- #budget presentation slide
- #table design PowerPoint
- #comparison table slide template
About the Product
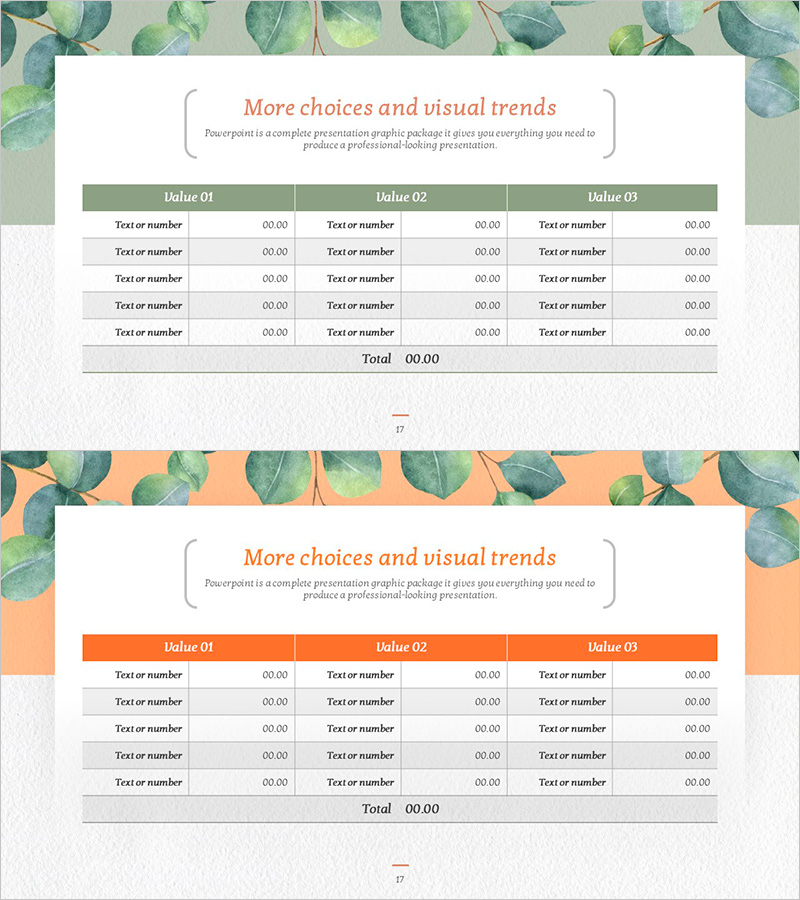
A 2-slide PowerPoint set featuring 3-column data tables with eucalyptus-inspired color palette. The first slide displays a green header with 5 data entry rows, while the second slide uses an orange header with identical structure. Each table is designed for clear numerical and text input, making it ideal for financial data, budget summaries, sales performance, and comparative analysis. Delivered in 16:9 widescreen PPTX format, fully editable with natural-toned background and contrasting header colors that enhance information hierarchy and readability.
Usage Points
-
Main Usage
Present quantitative data—financial summaries, budget allocations, sales figures, cost analysis—organized into three comparable categories. The row-based structure accommodates item names and numerical values, making it suitable for data sections in reports, proposals, and business plans.
-
How to Use
Select Slide 1 (green header) or Slide 2 (orange header) based on document context. Enter category names in header cells (Value 01, 02, 03) and populate data rows with text and figures. Customize header background color to match brand guidelines if needed.
-
Recommended For
Finance, planning, and sales teams presenting quarterly reports, budget allocation meetings, and sales performance reviews. Particularly effective for comparing three departments, regions, or product lines side-by-side.
-
Slide Structure
2-slide set. Slide 1: Green header (3 columns) + 5 data rows + total row. Slide 2: Orange header (3 columns) + identical 5-row structure. All cells support text and numerical input with evenly distributed row heights and column widths for optimal readability.
Related Products
-

Graph of Operating Cost Reduction Strategies
#Financial Plans and Performance #Diagram #Graph
-

Love and Data Charts – Visualizing Financial Performance
#Financial Plans and Performance #Diagram #Budget
-

Rhombus Presentation Template Table Chart – Optimized for Financial Planning and Performance
#Financial Plans and Performance #Diagram #Budget
-

Standard Table Slide Design – Effective Data Comparison
#Financial Plans and Performance #Diagram #Budget
