Standard Table Slide Design – Effective Data Comparison
RB0800028-1_19
- Last Update 03/23/2025
- File Size 0.2MB
- # of Slides 2
- File Format PPTX
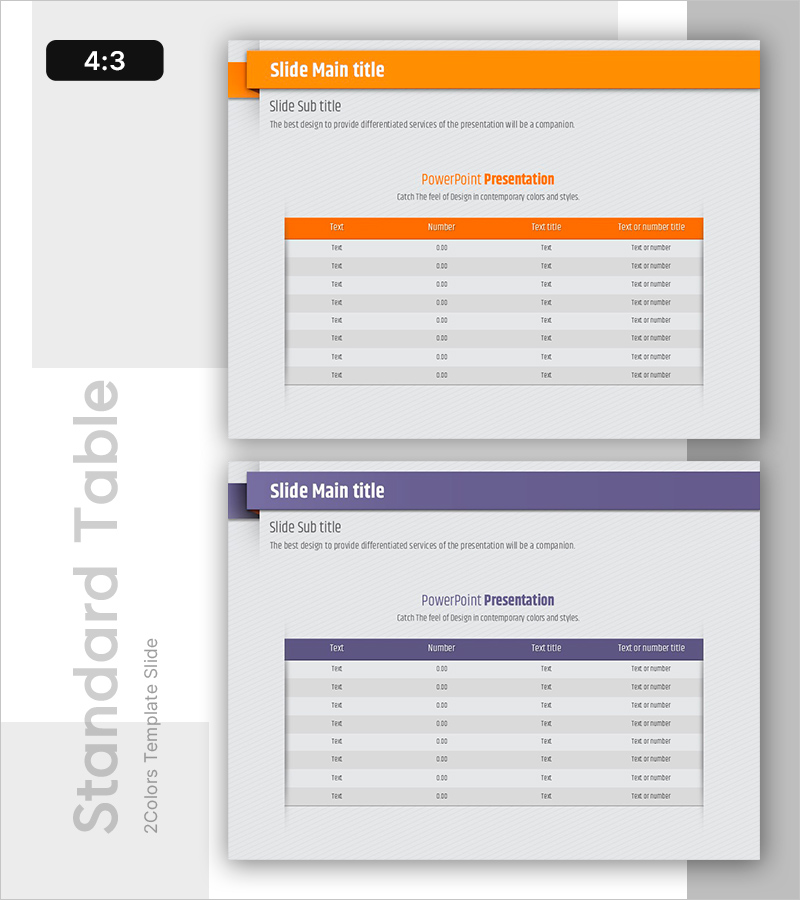
- Slide Ratio 4:3
- Color
Keywords
About the Product
Essential data comparison table slides for corporate presentations and business reports. This PowerPoint template features two layout variations with orange and purple headers, enabling clear organization of numerical values, text, and categorical information. The 4:3 aspect ratio set includes 2 slides with ready-to-edit rows for immediate use in financial reports, market analysis, product comparisons, and performance summaries. Each slide accommodates 8 rows of data across 4 columns, making it ideal for presenting structured information in professional settings.
Usage Points
-
Main Usage
Present quantitative metrics and qualitative information side-by-side for comparative analysis. The color-coded headers (orange and purple) emphasize different data categories, while 8 data rows enable systematic presentation of performance figures, specifications, market insights, and analytical findings to enhance audience comprehension.
-
How to Use
Input company performance metrics, product specifications, market data, or competitive analysis into the editable text cells. Use the orange header slide for primary indicators and the purple header slide for secondary metrics, or arrange both slides sequentially to show time-based or regional comparisons.
-
Recommended For
Finance teams presenting quarterly earnings reports, marketing teams sharing market research findings, sales teams comparing product features, and executives preparing strategic briefings. Also suitable for academic presentations, consulting proposals, and business plan financial sections.
-
Slide Structure
2-slide set with 4 columns (text, number, text, text/number) and 8 data rows per slide. First slide features orange header row; second slide uses purple header row. Both maintain consistent grid layout for seamless data entry and visual consistency.
Related Products
-

Graph of Operating Cost Reduction Strategies
#Financial Plans and Performance #Diagram #Graph
-

Rhombus Presentation Template Table Chart – Optimized for Financial Planning and Performance
#Financial Plans and Performance #Diagram #Budget
-

Love and Data Charts – Visualizing Financial Performance
#Financial Plans and Performance #Diagram #Budget
-

Eucalyptus Table Presentation Slide
#Financial Plans and Performance #Diagram #Budget
