Love and Data Charts – Visualizing Financial Performance
RJ0500037_14
- Last Update 06/17/2025
- File Size 1MB
- # of Slides 2
- File Format PPTX
- Slide Ratio 16:9
- Color
Keywords
About the Product
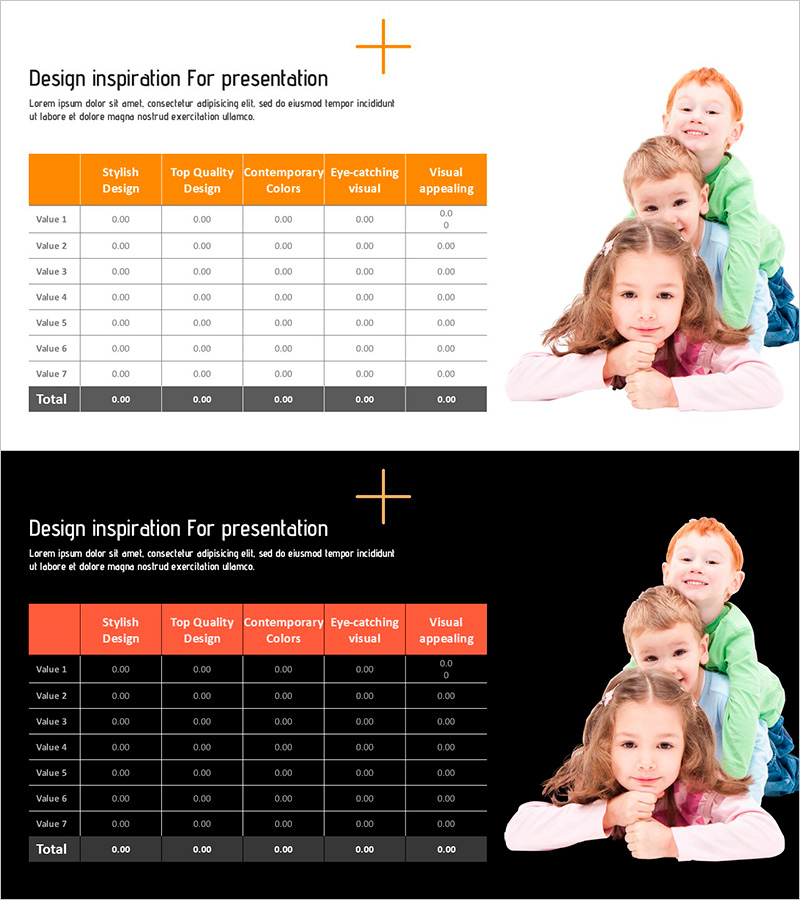
A professional 7-row comparison table PowerPoint slide designed for visualizing financial performance and key metrics at a glance. This presentation template includes two layout versions: one with an orange header on a light background and another with the same structure on a dark background. The table features 5 evaluation columns (Stylish Design, Top Quality Design, Contemporary Colors, Eye-catching Visual, Visual appealing) and 7 data rows for entering your metrics. Both versions are fully editable and ready to use in financial reports, performance analysis, comparative evaluations, and business presentations.
Usage Points
-
Main Usage
Present financial performance, evaluation metrics, and comparative data in a structured table format that enables audiences to compare multiple items simultaneously and understand complex information clearly.
-
How to Use
Use the orange header version for bright presentation environments and the dark background version for dimly lit rooms or projector displays. Simply input your header text and numerical data into each cell to customize the template for your specific needs.
-
Recommended For
Finance teams, executives, analysts, and consultants presenting performance reports, budget analysis, and departmental comparisons. Ideal for business plans, quarterly performance reports, investment proposals, and data-driven presentations.
-
Slide Structure
Two-slide set: Slide 1 features an orange header with light background table; Slide 2 presents the identical structure with dark background. Each table contains 5 columns (Stylish Design, Top Quality Design, Contemporary Colors, Eye-catching Visual, Visual appealing) and 7 data rows (Value 1–7) plus a Total row.
Related Products
-

Graph of Operating Cost Reduction Strategies
#Financial Plans and Performance #Diagram #Graph
-

Standard Table Slide Design – Effective Data Comparison
#Financial Plans and Performance #Diagram #Budget
-

Rhombus Presentation Template Table Chart – Optimized for Financial Planning and Performance
#Financial Plans and Performance #Diagram #Budget
-

Eucalyptus Table Presentation Slide
#Financial Plans and Performance #Diagram #Budget
