Visually Enhanced Bar Graph by Promotional Product Performance
RB0800019_6
- Last Update 03/21/2025
- File Size 4.6MB
- # of Slides 2
- File Format PPTX
- Slide Ratio 4:3
- Color
Keywords
- #Content-Based Slides
- #Design-Based Slides
- #Business Strategy
- #Market and Competitor Analysis
- #Graph
- #Achievements
- #Competitive Advantage
- #Column
- #Column Chart
- #4:3
- #vertical bar chart PowerPoint
- #bar graph slide template
- #performance comparison chart
- #data visualization PPT
- #business metrics PowerPoint slide
About the Product
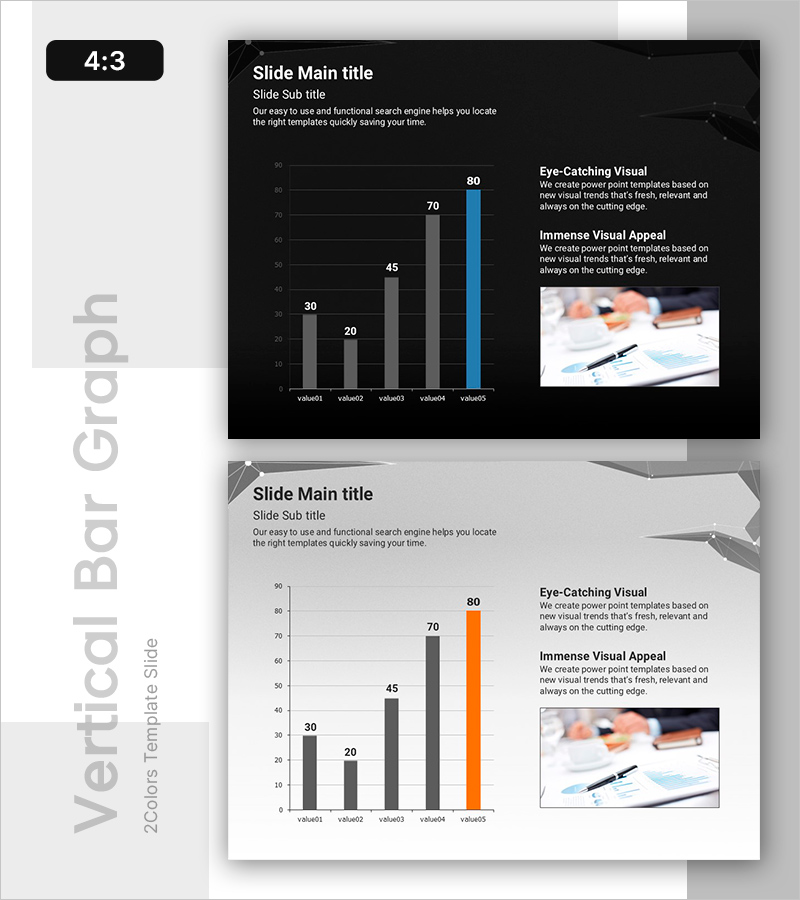
A vertical bar chart PowerPoint slide comparing promotional product performance across five data points with dark background and color-coded bars (gray, orange, and blue) that emphasize the final highest-value item. The right side includes descriptive text sections titled 'Eye-Catching Visual' and 'Immense Visual Appeal' alongside a business photograph to reinforce presentation context. Delivered in 4:3 aspect ratio PPTX format, fully editable for sales performance, marketing campaign results, market share analysis, and competitive positioning presentations.
Usage Points
-
Main Usage
Compares five data points such as promotional product sales, marketing campaign performance, or market metrics, with visual emphasis on the highest-performing item. The dark background bar chart conveys professional business results, while the right-side text area reinforces key messaging and strategic insights.
-
How to Use
Replace the five bar values (value01 through value05) with your actual data and update corresponding labels. The color-coded bars (gray, orange, blue) represent data hierarchy on the dark background. Add your core talking points in the right-side text box to integrate visual and narrative elements. Optimized for 4:3 widescreen presentation displays.
-
Recommended For
Quarterly performance reviews for sales and marketing teams, executive reports, investor presentations, and product sales analysis. Particularly effective for demonstrating promotional impact, competitive advantage, market share trends, and business growth metrics in corporate presentations.
-
Slide Structure
Two-slide set. First slide features dark background with five-item vertical bar chart (values 30, 20, 45, 70, 80) and right-side text area (title, subtitle, description, image). Second slide repeats the same chart structure on light gray background, providing color variation options for different presentation contexts.
Related Products
-

Bar Chart Visualizing Steak Consumption
#Business Strategy #Market and Competitor Analysis #Graph
-

Data Comparison: Then vs. Now – Performance and Competitive Edge
#Business Strategy #Market and Competitor Analysis #Graph
-

Growing Demand for Organic Agricultural Products Bar Chart
#Business Strategy #Market and Competitor Analysis #Graph
-

Sports Vertical Bar Chart – The Perfect Choice for Performance Analysis
#Business Strategy #Market and Competitor Analysis #Graph
