Market Analysis Template with Bilateral Bar Graph Visualization
RJ0200020_10
- Last Update 04/02/2025
- File Size 6.2MB
- # of Slides 2
- File Format PPTX
- Slide Ratio 16:9
- Color
Keywords
- #Content-Based Slides
- #Design-Based Slides
- #Market and Competitor Analysis
- #Financial Plans and Performance
- #Graph
- #Market Status
- #Sales and Revenue
- #Horizontal Bar
- #Double Horizontal Bar
- #16:9
- #bilateral bar chart PowerPoint
- #horizontal bar graph slide template
- #data comparison chart
- #market analysis presentation
- #two-sided bar graph slide design
About the Product
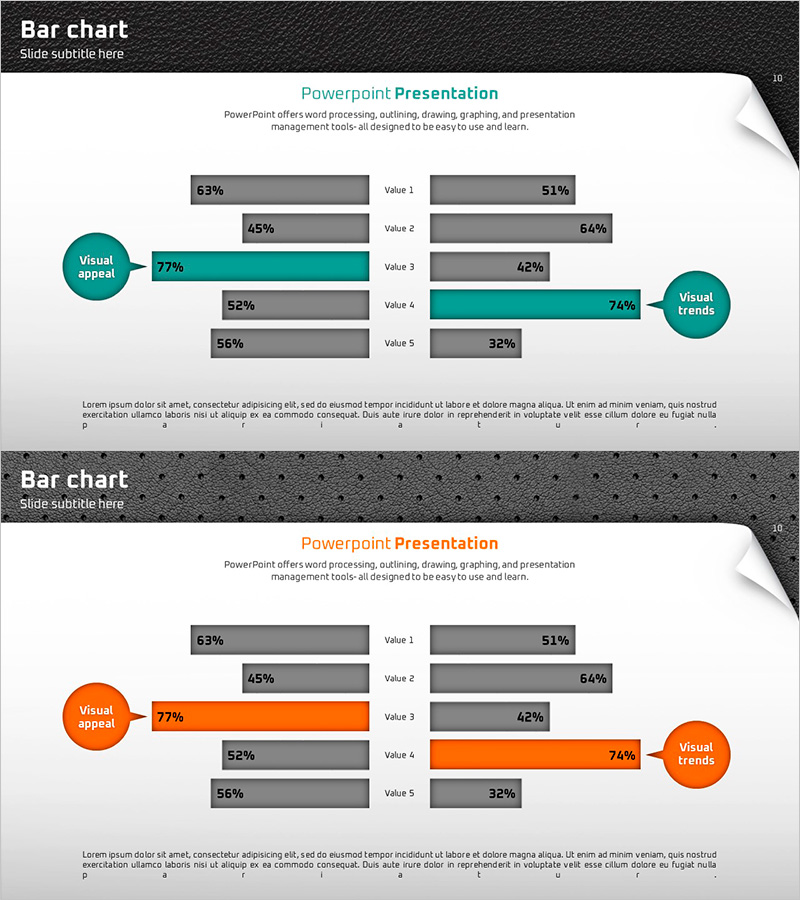
A symmetrical horizontal bar chart design comparing two data series side-by-side for clear contrast analysis. This PowerPoint slide is optimized for market analysis, financial planning, and performance comparisons. Five items are displayed with left-side bars (gray) and right-side bars (accent color), anchored by circular icons highlighting key concepts. Designed for 16:9 widescreen format, this presentation slide template is ready to use in reports, proposals, and business decks.
Usage Points
-
Main Usage
Enable intuitive side-by-side comparison of two data series. Ideal for competitive market analysis, budget versus actual reporting, goal versus achievement metrics, and any presentation requiring direct data contrast.
-
How to Use
Set left bars as baseline values (gray) and right bars as comparison values (accent color). Input five data points and bar lengths adjust automatically. Customize circular icons and text labels to match your presentation topic and data context.
-
Recommended For
Marketing professionals analyzing competitive landscapes, finance teams presenting budget variance reports, executives delivering performance reviews, consultants preparing comparative analyses, and sales teams creating client comparison proposals.
-
Slide Structure
Two-slide set with color variations: first slide features teal accent, second slide features orange accent. Each slide contains five bilateral horizontal bars (gray left + accent right), paired circular icons on both sides, and centered text labels. 16:9 widescreen format throughout.
Related Products
-

Online Presentation Template – Bilateral Bar Graph
#Market and Competitor Analysis #Financial Plans and Performance #Graph
-

Rainbow Presentation Template Bilateral Bar Graph – Market Status and Financial Analysis
#Market and Competitor Analysis #Financial Plans and Performance #Graph
-

Social Distancing Vaccination Rate Comparison Graph – Essential Tool for Market Analysis
#Market and Competitor Analysis #Financial Plans and Performance #Graph
-

Bar Graph Visualization of Pet Data
#Market and Competitor Analysis #Financial Plans and Performance #Graph
