Rainbow Presentation Template Bilateral Bar Graph – Market Status and Financial Analysis
RJ0200022_6
- Last Update 04/03/2025
- File Size 3.9MB
- # of Slides 2
- File Format PPTX
- Slide Ratio 16:9
- Color
Keywords
- #Content-Based Slides
- #Design-Based Slides
- #Market and Competitor Analysis
- #Financial Plans and Performance
- #Graph
- #Market Status
- #Sales and Revenue
- #Horizontal Bar
- #Double Horizontal Bar
- #16:9
- #bilateral bar chart PowerPoint
- #left-right comparison slide template
- #symmetrical graph design
- #market analysis presentation
- #financial comparison slide
About the Product
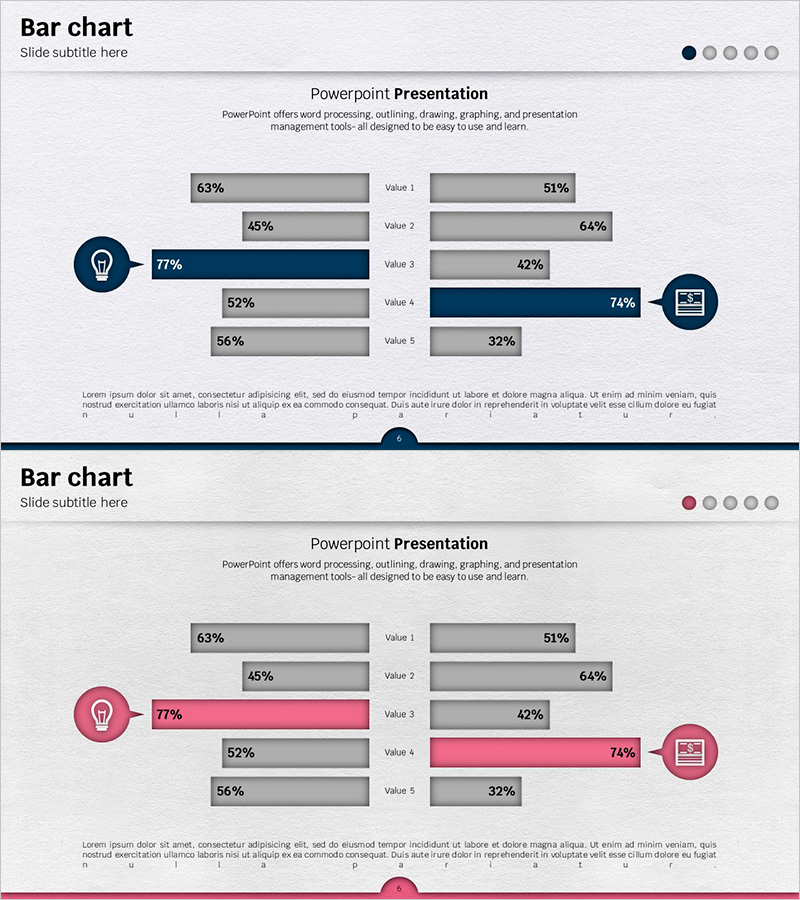
A bilateral bar chart PowerPoint slide featuring a symmetrical left-right layout for comparing two data series across five items. This design is ideal for market analysis, financial performance comparison, competitive benchmarking, and performance metrics. The slide uses a dual-color scheme with navy blue on the left and pink on the right to distinguish data sets, with a central icon highlighting the comparison theme. Delivered in 16:9 widescreen format with 2 fully editable slides, ready for business presentations, reports, and proposals.
Usage Points
-
Main Usage
This slide enables side-by-side comparison of two data series using a symmetrical bilateral bar layout. Perfect for contrasting metrics such as current vs. target, year-over-year performance, or company vs. competitor analysis. The central icon emphasizes the comparison theme and draws audience focus.
-
How to Use
Input your data values for each of the five items on both left and right sides. The bar lengths adjust automatically to reflect your numbers. The color coding (navy left, pink right) instantly distinguishes the two data sets. Replace the central icon to match your analysis topic—finance, market, performance, or strategy.
-
Recommended For
Finance teams presenting performance analysis, marketing teams sharing market research findings, executive reports, strategic planning documents, and investor pitch decks. Particularly effective for board presentations, C-suite briefings, and client proposals requiring dual-perspective data comparison.
-
Slide Structure
2-slide set. Each slide displays a bilateral bar chart with 5 items: left bars in navy blue (63%, 45%, 77%, 52%, 56%) and right bars in pink/gray (51%, 64%, 42%, 74%, 32%). A central icon (lightbulb or presentation symbol) anchors the visual hierarchy and reinforces the comparison narrative.
Related Products
-

Market Analysis Template with Bilateral Bar Graph Visualization
#Market and Competitor Analysis #Financial Plans and Performance #Graph
-

Online Presentation Template – Bilateral Bar Graph
#Market and Competitor Analysis #Financial Plans and Performance #Graph
-

Slide Comparing Sales Trends by Year – Data Visualization
#Market and Competitor Analysis #Financial Plans and Performance #Diagram
-

Newspaper Wide PowerPoint Template Line Chart - Market Analysis and Revenue Performance
#Market and Competitor Analysis #Financial Plans and Performance #Graph
