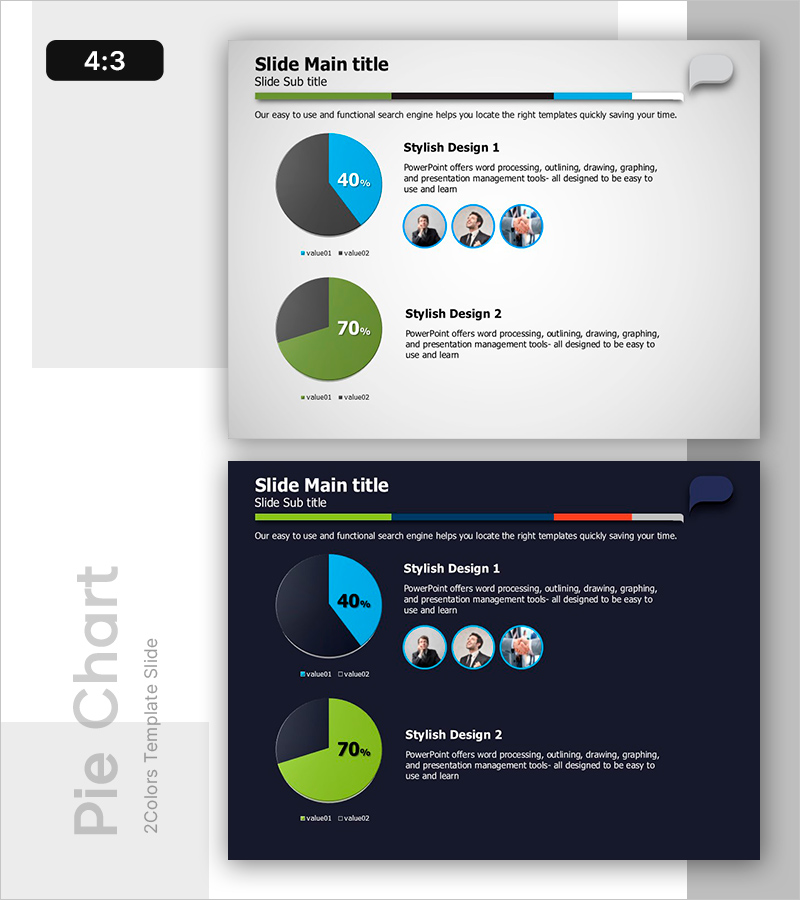
Two Pie Charts with Commentary – Market Share Analysis
RB0800054_6
- Last Update 03/26/2025
- File Size 0.5MB
- # of Slides 2
- File Format PPTX
- Slide Ratio 4:3
- Color
Keywords
About the Product
A professional two-slide pie chart PowerPoint template optimized for market share analysis and data comparison. Features dual design options with light and dark backgrounds, each displaying proportional data (40% and 70%) alongside explanatory text and profile icons. Fully editable structure compatible with all PowerPoint versions in 4:3 aspect ratio PPTX format. Ideal for business presentations, executive reports, and financial analysis decks where visual data representation is essential.
Usage Points
-
Main Usage
Visualize proportional data such as market share, sales distribution, and customer composition using two-segment pie charts. Effectively communicate key metrics in executive briefings, investor presentations, and market analysis reports.
-
How to Use
Double-click the pie chart percentages (40%, 70%) to input your actual data values. Edit the explanatory text box with relevant insights, and replace profile icons with team member photos. Select between light or dark background options to match your presentation theme.
-
Recommended For
Financial analysts, marketing managers, business intelligence professionals, and executives presenting quarterly results, market penetration data, customer segmentation, or competitive positioning analysis.
-
Slide Structure
Two-slide set. Each slide features a two-segment pie chart on the left (gray-blue and gray-green color schemes), explanatory text area on the right, and three circular profile icon placeholders. Title and subtitle sections at top. 4:3 aspect ratio PPTX format.
Related Products
-

Pie Chart for Oriental Medicines Market Overview
#Market and Competitor Analysis #Graph #Market Status
-

Pie Chart for Market Share Analysis – Data Visualization
#Market and Competitor Analysis #Graph #Market Status
-

3D Pie Chart Analysis (Green & Blue) – Market Share Visualization
#Market and Competitor Analysis #Graph #Market Status
-

Pie Chart for Workout Type Preferences – Market Status
#Market and Competitor Analysis #Diagram #Graph
