Five Color Wide Template – Donut Chart
RJ0200009_32
- Last Update 03/30/2025
- File Size 4.6MB
- # of Slides 2
- File Format PPTX
- Slide Ratio 16:9
- Color
Keywords
- #Content-Based Slides
- #Design-Based Slides
- #Product/Service Introduction
- #Market and Competitor Analysis
- #Graph
- #Features
- #Competitive Advantage
- #Circles
- #Doughnut Chart
- #16:9
- #donut chart PowerPoint
- #pie chart slide template
- #data ratio visualization PPT
- #marketing analysis chart
- #concentric ring diagram PowerPoint slide
About the Product
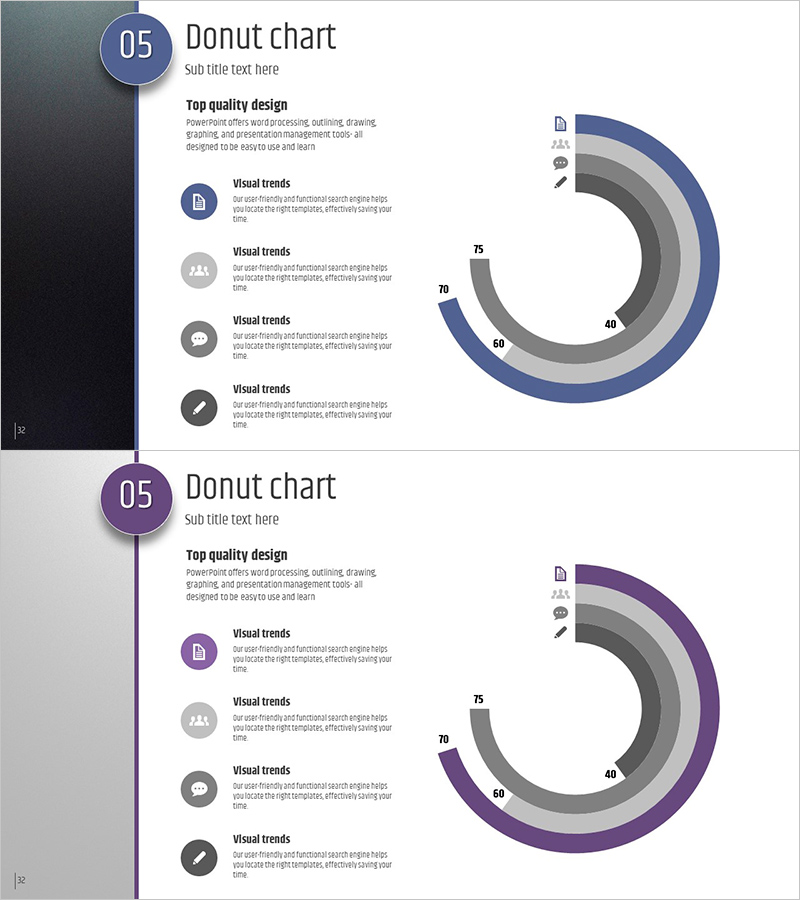
A professional donut chart PowerPoint slide designed for marketing strategy and business analysis presentations. This 2-slide set features a blue and purple dual-tone color scheme that visualizes 4 data series (40, 60, 70, 75) in concentric ring structure, enabling intuitive ratio comparison and composition analysis. The left text area accommodates 4 explanation points with icon buttons, enhancing information delivery efficiency. Created in 16:9 widescreen format for seamless compatibility with modern projectors and digital displays, provided as fully editable PPTX files.
Usage Points
-
Main Usage
Visualize marketing performance metrics, market share distribution, budget allocation breakdown, and customer satisfaction survey results across 4 data categories simultaneously, providing clear evidence for executive decision-making.
-
How to Use
Enter descriptive text for each item in the left text area and replace the chart values (40, 60, 70, 75) with your actual data. Blue and purple colors are fully customizable to match corporate branding, and the 2-slide template can be duplicated to represent multiple data sets.
-
Recommended For
Marketing teams presenting campaign performance reports, executive-level business analysis presentations, sales teams explaining market conditions, consulting firms preparing client proposals, and finance teams presenting budget composition breakdowns.
-
Slide Structure
Each slide combines a left vertical bar (blue/purple) with a right-aligned donut chart. The donut comprises 4 concentric ring layers representing different data series. The left panel features 4 circular icon buttons with accompanying text areas for item descriptions.
Related Products
-

Doughnut Chart for Coffee Bean Preference Analysis – Market Trends
#Product/Service Introduction #Market and Competitor Analysis #Graph
-

Natural Recreation Area Preference Chart – Market Status Analysis
#Market and Competitor Analysis #Diagram #Graph
-

Animals Nature Donut Chart Infographics – Market Share Analysis
#Market and Competitor Analysis #Graph #Market Share
-

Visualization of War Equipment Penetration Rate – Market Share Analysis
#Market and Competitor Analysis #Graph #Market Share
