Natural Recreation Area Preference Chart – Market Status Analysis
RJ0600094_6
- Last Update 07/16/2025
- File Size 0.4MB
- # of Slides 2
- File Format PPTX
- Slide Ratio 16:9
- Color
Keywords
- #Content-Based Slides
- #Design-Based Slides
- #Market and Competitor Analysis
- #Diagram
- #Graph
- #Market Status
- #Competitive Advantage
- #Cluster
- #Circles
- #Closed Cluster Diagram
- #Doughnut Chart
- #16:9
- #donut chart PowerPoint
- #pie chart slide template
- #preference analysis chart
- #market analysis PPT
- #3-segment donut graph PowerPoint
About the Product
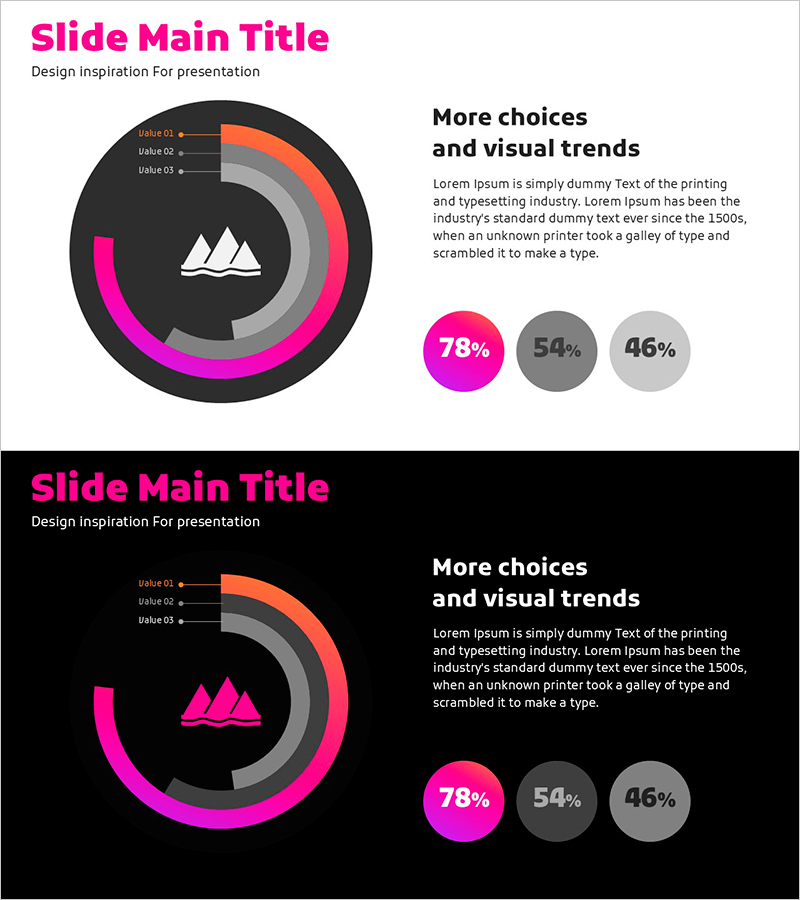
A donut chart PowerPoint slide visualizing natural recreation area preferences across three segments. The design features a dark background with magenta, orange, and gray color segments in a circular graph format, paired with a text area on the right for additional context. This 2-slide set includes both a light background version and a black background version, allowing you to match your presentation environment. Ideal for tourism, travel, marketing, and market research presentations where consumer preference data needs clear visual representation.
Usage Points
-
Main Usage
Visualize consumer preferences for natural recreation areas, tourism destinations, or products using a donut chart format. The circular structure allows central placement of key metrics or icons, enhancing data emphasis and audience engagement.
-
How to Use
Use in marketing reports, market research presentations, executive briefings, and tourism industry proposals to display preference distribution percentages. Input segment descriptions, numerical values, and insights in the right text area to provide data context and storytelling.
-
Recommended For
Marketing professionals, market research analysts, tourism and travel industry specialists, business executives, real estate professionals, and students presenting preference data or market analysis findings.
-
Slide Structure
3-segment donut chart (magenta, orange, gray) with central icon area and right-aligned text box containing title, description, and legend. Total 2 slides: light background version and black background version.
Related Products
-

Doughnut Chart Slide for Market and Competitive Analysis – Sports Trends & Strategic Issues
#Market and Competitor Analysis #Diagram #Graph
-

SUV Percentage Donut Graph – Market Status Analysis
#Market and Competitor Analysis #Diagram #Graph
-

Leaves Donut Chart – Fresh Approach to Data Visualization
#Product/Service Introduction #Market and Competitor Analysis #Diagram
-

User Experience Advantage Analysis Chart – Visualizing Competitive Edge
#Product/Service Introduction #Market and Competitor Analysis #Diagram
