Visualizing Business Performance with Tube Donut Chart – Strategies for Competitive Advantage
RJ0600080_24
- Last Update 07/11/2025
- File Size 0.2MB
- # of Slides 2
- File Format PPTX
- Slide Ratio 16:9
- Color
Keywords
- #Content-Based Slides
- #Design-Based Slides
- #Business Strategy
- #Market and Competitor Analysis
- #Graph
- #Achievements
- #Competitive Advantage
- #Circles
- #Doughnut Chart
- #16:9
- #doughnut chart PowerPoint
- #donut graph slide template
- #concentric ring data visualization
- #multi-layer chart slide
- #business performance PPT
About the Product
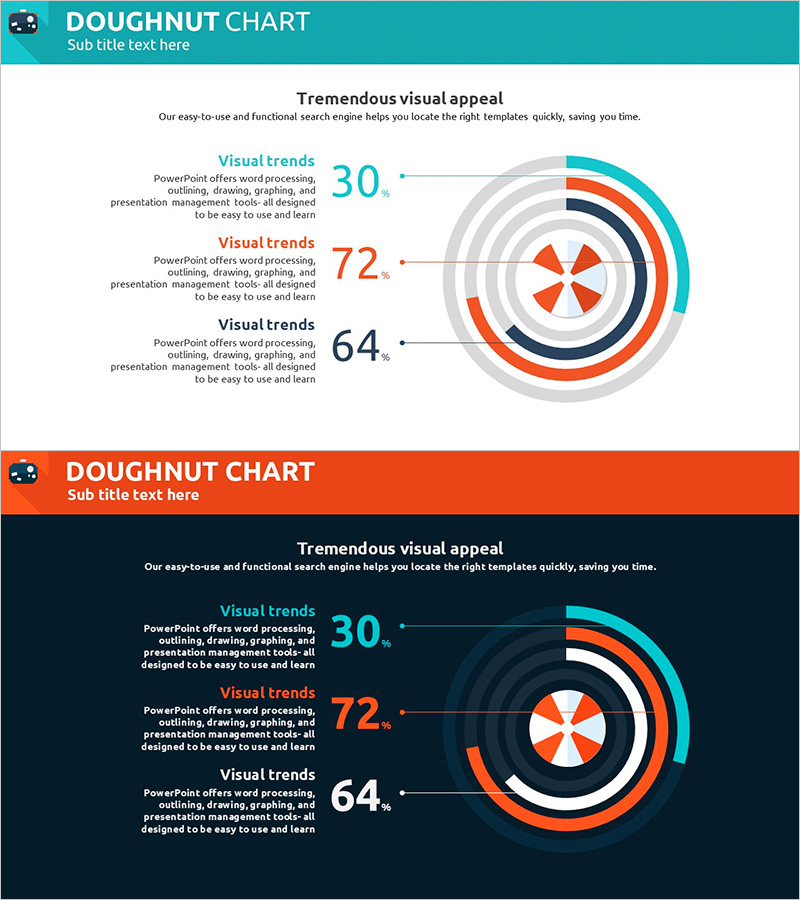
A professional doughnut chart PowerPoint slide designed to visualize business performance and competitive advantage with clarity. The three-layer concentric ring structure with central numeric values enables hierarchical data comparison and multi-metric analysis. The color scheme combines turquoise, orange, and navy tones to distinguish each data series, while left-aligned text labels with arrow connectors guide audience attention intuitively. Two background versions—light and dark—are included to adapt to various presentation environments and screen displays. Delivered as 2 slides in 16:9 aspect ratio, PPTX format, fully editable and ready to customize.
Usage Points
-
Main Usage
Visualize three or more hierarchical data points simultaneously—such as business performance metrics, market share distribution, competitive positioning, or customer satisfaction levels. The combination of central numeric values and outer concentric rings allows simultaneous presentation of headline figures and detailed composition, making it ideal for strategy presentations, performance reports, and market analysis briefings.
-
How to Use
Enter item names and descriptions in the left text area, then adjust the central number and outer ring colors and sizes to match your data values. Use arrow connectors to link text labels to chart elements, guiding viewer attention through the visualization. Apply the light background version for printed materials and the dark version for large-screen presentations or digital displays.
-
Recommended For
Recommended for executives, strategy managers, marketing teams, and sales professionals presenting business performance, market competitiveness, customer satisfaction, or product portfolio comparisons. Particularly effective in reports, strategy meetings, investor presentations, and board-level briefings where three or more metrics require hierarchical comparison.
-
Slide Structure
Two-slide set with contrasting backgrounds: Slide 1 features a light background with turquoise header and white content area; Slide 2 uses a dark background with black content and turquoise accents. Each slide combines a left-aligned three-row text area with a center-aligned doughnut chart. The chart displays a central circular value surrounded by three concentric rings in turquoise, orange, and navy, representing distinct data layers.
Related Products
-

Progress Donut Chart for Each Library Service
#Business Strategy #Market and Competitor Analysis #Graph
-

Construction Facilities Status Donut Chart – Visualizing Business Strategies
#Business Strategy #Market and Competitor Analysis #Graph
-

Yoga's Advantage Donut Chart – Path to Wellness
#Business Strategy #Market and Competitor Analysis #Graph
-

Smart Healthcare Donut Chart – Market and Competition Analysis
#Business Strategy #Market and Competitor Analysis #Graph
