Doughnut Chart for Coffee Bean Preference Analysis – Market Trends
RJ0600057_18
- Last Update 07/05/2025
- File Size 4.6MB
- # of Slides 2
- File Format PPTX
- Slide Ratio 16:9
- Color
Keywords
- #Content-Based Slides
- #Design-Based Slides
- #Product/Service Introduction
- #Market and Competitor Analysis
- #Graph
- #Features
- #Competitive Advantage
- #Circles
- #Doughnut Chart
- #16:9
- #doughnut chart PowerPoint
- #pie chart slide template
- #ratio analysis chart
- #market analysis graph
- #product preference PPT
- #data visualization slides
About the Product
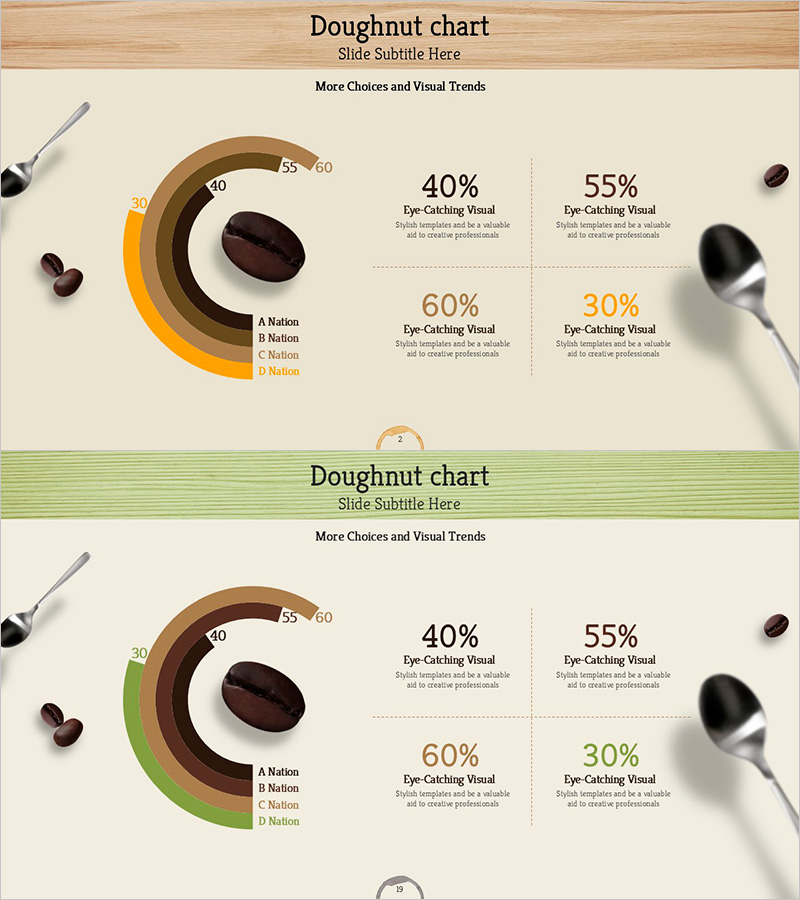
A doughnut chart PowerPoint slide optimized for coffee market analysis and product preference research. This 2-slide template visualizes the ratio of four items with a warm color palette of brown, orange, and cream tones that harmonize with the coffee theme. The central circular area highlights key metrics while the right side displays percentage data in a structured layout. Each slide includes a legend supporting category comparisons such as A Nation, B Nation, C Nation, and D Nation. Immediately applicable to presentations, market reports, and product introduction materials.
Usage Points
-
Main Usage
Visualizes the composition ratio of four items such as market share, consumer preference, and sales distribution using a doughnut chart. The central circular area emphasizes key metrics while percentage data is arranged on the right side for immediate comparative analysis.
-
How to Use
Use in market analysis, product introduction, and competitive advantage sections. Replace the Nation items in the legend with actual brand names, regions, or categories, and edit percentage figures to match your data for immediate presentation use.
-
Recommended For
Marketing managers, product planners, sales executives, and market analysts explaining customer preferences, market share, and sales composition. Applicable to coffee and beverage industries as well as all product categories requiring ratio analysis presentations.
-
Slide Structure
2-slide composition. Each slide features a 4-segment doughnut chart on the left (brown, orange, cream, and beige), percentage figures (40%, 55%, 60%, 30%) in the center, and 'Eye-Catching Visual' text area on the right. A legend at the bottom (A Nation, B Nation, C Nation, D Nation) clearly distinguishes categories.
Related Products
-

Five Color Wide Template – Donut Chart
#Product/Service Introduction #Market and Competitor Analysis #Graph
-

Donut Chart Slide Visualizing Distribution and Transportation Status
#Market and Competitor Analysis #Graph #Market Status
-

Green Red Donut Chart – Market Share Analysis
#Market and Competitor Analysis #Graph #Market Share
-

Solar System Pie Graph – Stylish Presentation Design
#Business Introduction #Market and Competitor Analysis #Graph
