Five Color Powerpoint Template Wide - Mixed Graphs
RJ0200009_19
- Last Update 03/30/2025
- File Size 4.6MB
- # of Slides 2
- File Format PPTX
- Slide Ratio 16:9
- Color
Keywords
About the Product
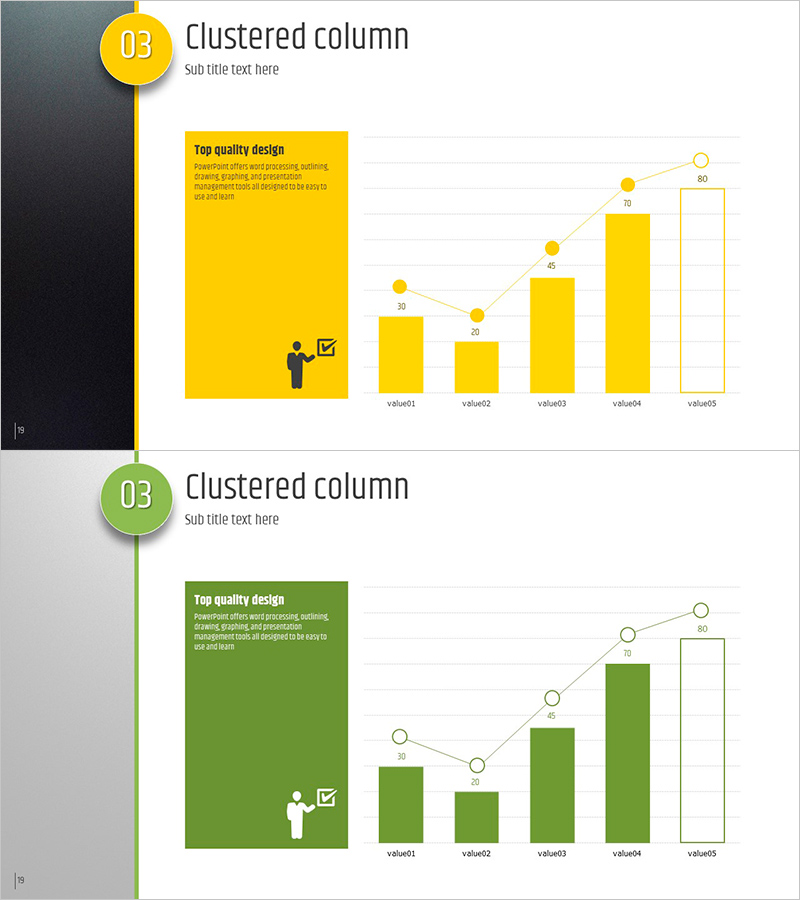
A hybrid chart PowerPoint template combining column bars and line graphs on a single slide for comprehensive data visualization. Features yellow, green, and gray accent colors representing five data values with dual-axis comparison capability. The left text box area highlights key insights while the right chart section displays both magnitude (bars) and trend (line) simultaneously. Ideal for market analysis presentations, competitive benchmarking, sales forecasting, and multi-dimensional business reports. Delivered in 16:9 widescreen format with 2 fully editable slides.
Usage Points
-
Main Usage
Simultaneously display quantitative comparison (bar chart) and trend analysis (line graph) to reveal both absolute values and directional movement. Enables stakeholders to identify performance gaps, growth trajectories, and market dynamics in a single visual, reducing cognitive load during executive presentations.
-
How to Use
Replace the left-side text box with your analysis title and key findings. Update the five data values (value01 through value05) with your actual metrics. The yellow and green bars represent two distinct data series, while the overlaid line tracks cumulative or comparative trend. All elements are fully editable within PowerPoint.
-
Recommended For
Marketing strategists, financial analysts, business consultants, operations managers, and C-suite executives presenting quarterly results, market research findings, competitive analysis, or strategic forecasts. Particularly effective for investor presentations, board reports, and cross-functional business reviews.
-
Slide Structure
Slide 1: Yellow-themed layout with left text annotation box and right-aligned hybrid chart displaying 5 data points with dual-axis representation. Slide 2: Green-themed variant with identical chart structure. Both slides include value labels, trend line with data markers, and legend indicators for clear multi-series identification.
Related Products
-

Cartoon Theme Area Type Future Outlook Graph
#Market and Competitor Analysis #Graph #Other
-

Year-by-Year Breakdown Comparison Analysis Graph
#Market and Competitor Analysis #Graph #Future Outlook
-

Visualization of Learning Response Data – Market Trend Analysis
#Market and Competitor Analysis #Graph #Future Outlook
-

Watercolor Future Market Outlook Line Graph
#Market and Competitor Analysis #Graph #Future Outlook
