Childbirth Age Comparison Analysis Graph – Market Status and Forecast
RJ0400030_12
- Last Update 05/25/2025
- File Size 8.7MB
- # of Slides 2
- File Format PPTX
- Slide Ratio 16:9
- Color
Keywords
- #Content-Based Slides
- #Design-Based Slides
- #Market and Competitor Analysis
- #Graph
- #Other
- #Future Outlook
- #Industry Trends
- #16:9
- #childbirth age analysis PowerPoint slide
- #age group comparison line chart
- #demographic trend visualization
- #market analysis presentation slide
- #how to present population statistics in PowerPoint
About the Product
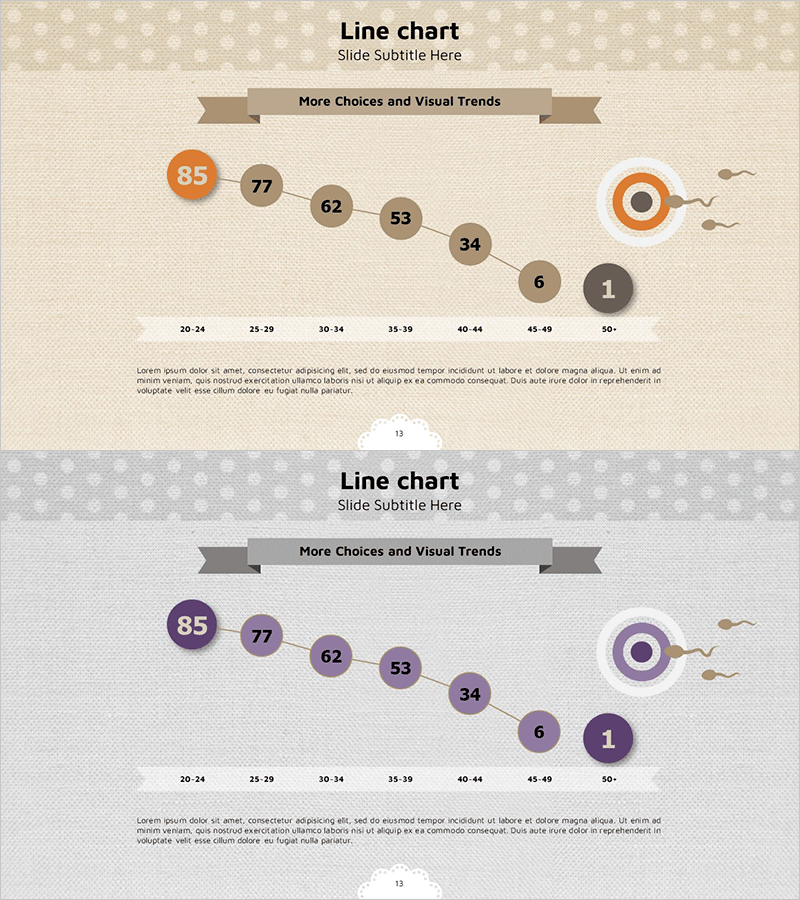
A PowerPoint slide featuring a line chart that compares and analyzes childbirth age trends across eight age groups from 20-24 to 50+. Available in two color versions—orange and purple—each clearly visualizing demographic shifts with descending trend lines and circular accent icons. The layout includes a ribbon banner header for titles and a description area at the bottom for insights. This slide is ready to use in market analysis presentations, demographic reports, policy proposals, and social statistics briefings.
Usage Points
-
Main Usage
Visualize childbirth age trends across age groups and time periods to communicate demographic data persuasively. The line chart's ascending and descending patterns serve as evidence for policy development and strategic decision-making in population-related initiatives.
-
How to Use
Deploy in market analysis presentations, demographic policy briefings, social statistics reports, and academic seminars to present data-driven insights. Directly edit age group values for real-time updates and select color versions to match your presentation tone.
-
Recommended For
Demographic analysts, policy makers, market researchers, academic scholars, and social issue presenters who need to support arguments with data. Ideal for government agencies, research institutes, consulting firms, and educational institutions.
-
Slide Structure
The slide comprises a ribbon banner title area at the top, a central line chart with eight age group data points, a circular accent icon on the right, and a description text area at the bottom. Two color layouts (orange and purple) are provided for flexible theme selection.
Related Products
-

Business Cartoon Theme Future Prospects – Visualizing Market Trends
#Market and Competitor Analysis #Diagram #Graph
-

Future Outlook Line Graph Blue Orange
#Market and Competitor Analysis #Graph #Other
-

National Trend Change Graph Visualization – Horizontal Bar Chart
#Market and Competitor Analysis #Graph #Other
-

Brown Green Area Chart – Data Trend Analysis
#Market and Competitor Analysis #Graph #Other
